Do YouTube Ads Still Perform?
Haus' Head of Strategic Insights Tyler Horner analyzes what’s held up since our last YouTube report, what’s shifted in the Demand Gen era, and best practices for YouTube in 2026.
Oct 14, 2026
Background
Most marketers have stopped asking whether YouTube can work. The harder question is what to do when the first test comes back looking worse than your other channels.
Eighteen months ago, our first YouTube report, “Do YouTube Ads Perform?”, made a pretty bold case for a channel most measurement setups can barely see. Back then, I joked that “upper-funnel” is mostly a polite way of saying shrug emoji, and YouTube was the poster child: held to brand standards and performance standards at the same time, and unable to meet both. The data told a different story. Google Ads was missing most of what YouTube drove, brands that sold beyond their own website saw lift roughly double, and the payoff kept landing for weeks after the ads stopped.
A lot has changed since: Demand Gen replaced video action campaigns, our library of YouTube tests has multiplied in size, and the businesses running these tests are bigger, with busier media mixes and more places for a customer to check out. So we went back to the data to see what’s held up and what’s shifted in the Demand Gen era.
Most of our prior findings held up: YouTube still does more than most scorecards give it credit for. What’s changed is how to buy it and what to do once you’ve proved it works.
Understanding the data
Every test is a causal read: Geo holdouts: real markets held out of YouTube spend with the gap as the measured lift. Comparisons across setups and eras are observational so read those as directional.
We index to the brand’s other channels: A raw ROAS swings with a brand’s margins, prices and category so we divide YouTube’s incremental return by what the same brand gets from its other channels tested within six months. 1.0x means YouTube did as well; 0.8x means 20% worse.
We studied lots of tests: These spanned a much wider range of businesses and verticals than 2025. Other channels are shown anonymously.
No single brand can move a number: We take each brand’s median result, then average across brands, so a brand with a pile of tests or one huge reading can’t swing the typical figure.
Test for your own business: None of these numbers are yours, and the only YouTube result that should move your budget is the one measured on your own data.
Google Ads still misses most of what YouTube drives
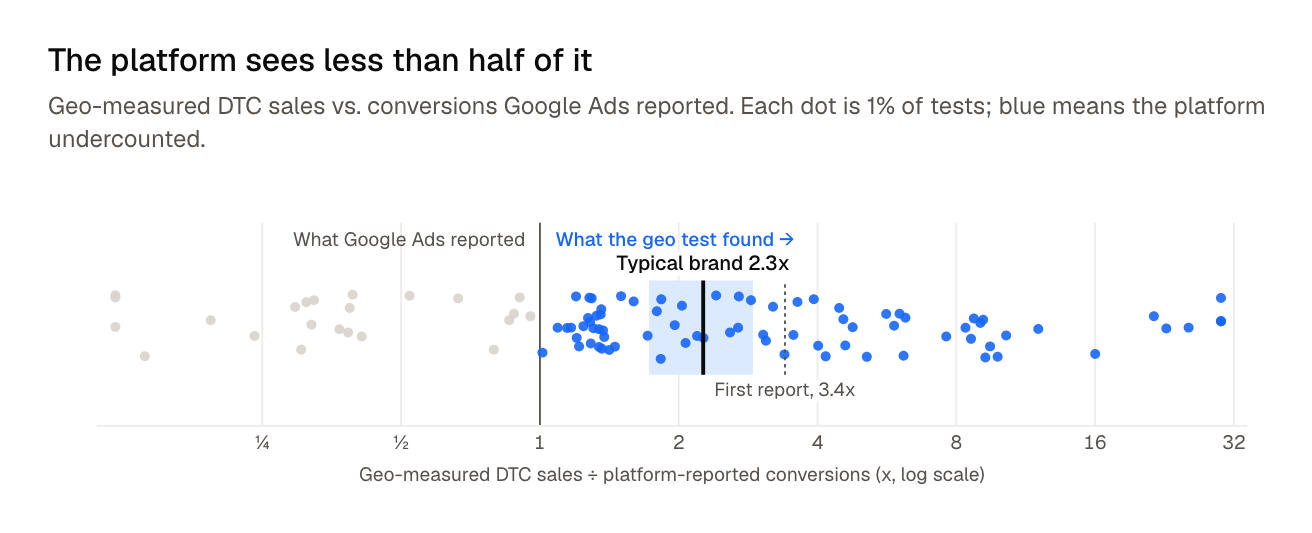
Geo tests consistently find more YouTube-driven sales than Google Ads reports. The typical brand’s geo test finds 2.3x the DTC sales the platform credited and about three in four tests land above the platform’s number. In other words, if Google Ads says YouTube drove 100 DTC sales, expect a geo test to find somewhere around 230.
That’s down from the 3.4x in our first report, but I wouldn’t read that as a negative. Google’s reporting may simply catch more of YouTube’s conversions now and Demand Gen may produce more of the kind it can track. The businesses in this dataset are also larger than the businesses in our previous report and have more complex media mixes. Whatever the blend, the direction hasn’t moved: The platform still sees less than half of what YouTube does.
It makes intuitive sense – a lot of YouTube gets watched on a TV that nobody clicks, by someone who buys later on another device – and none of this even counts sales that land on Amazon or in a store. Speaking of which…
The halo is still the thing most brands miss
This is still my favorite finding and the one I’d put in front of any brand that sells beyond its own site. For every dollar of incremental sales YouTube drives on a brand’s website, it drives another 75¢ on Amazon and at retail. The same brands’ other channels drive just 44¢.
Dollar for dollar, YouTube drives about 1.4x the incremental Amazon sales of the brand’s other channels, while on the brand’s own site it runs a bit behind them (0.87x).
Same dollar; it just gets paid somewhere else.
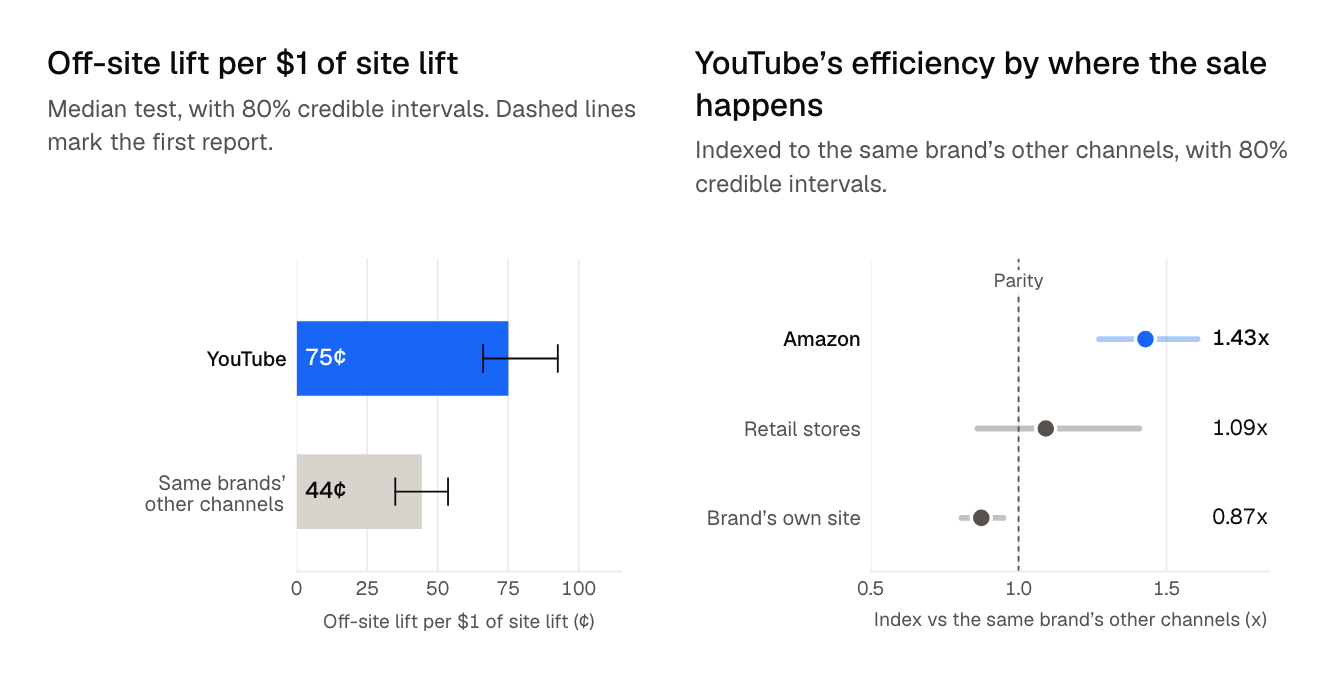
And this trend holds across tactics: Demand Gen, upper-funnel and other YouTube setups all land between roughly 72¢ and 85¢ of off-site lift per dollar of DTC lift and YouTube’s Amazon edge was about the same before and after Demand Gen. If your growth is moving onto shelves or into Amazon and the only KPI you watch is DTC revenue, you’re grading YouTube on the part of the job it does least well.
And on the site itself, YouTube’s lift on new-customer KPIs runs about 32% higher than on repeat-customer KPIs, roughly in line with brands’ other channels.
About a quarter of the payoff lands after the ads stop
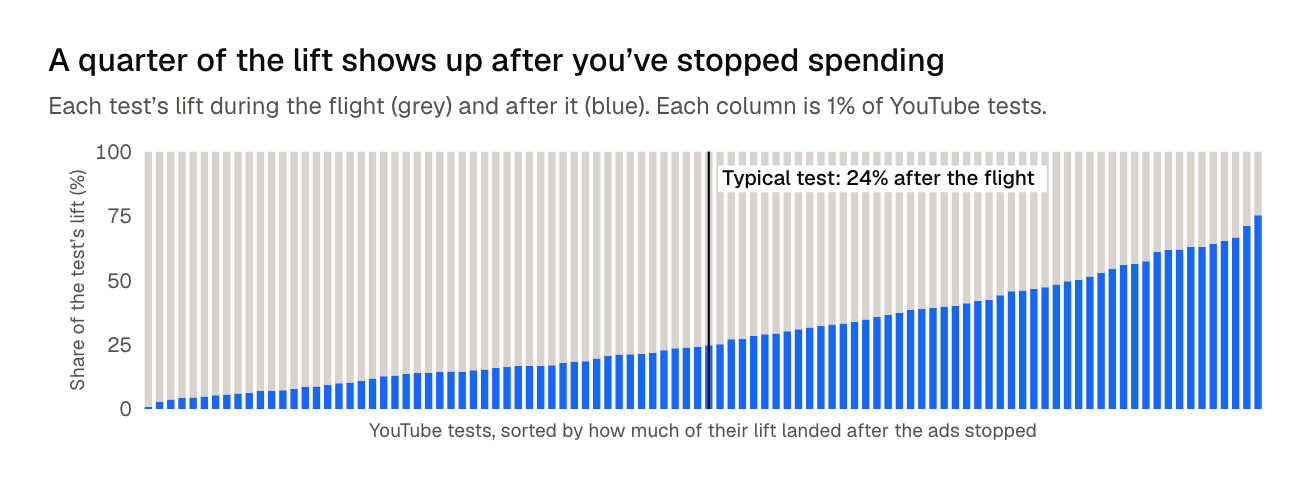
In our upper-funnel report earlier this year, about a quarter of incremental lift arrived after the media stopped running. YouTube sits right in that range: In the typical test, 24% of the lift landed in the post-treatment window. Put differently, a read taken the day the flight ends (usually the one that moves budget) grades YouTube on about three-quarters of its return, and counting the window lifts the typical test’s ROI by about 32%.
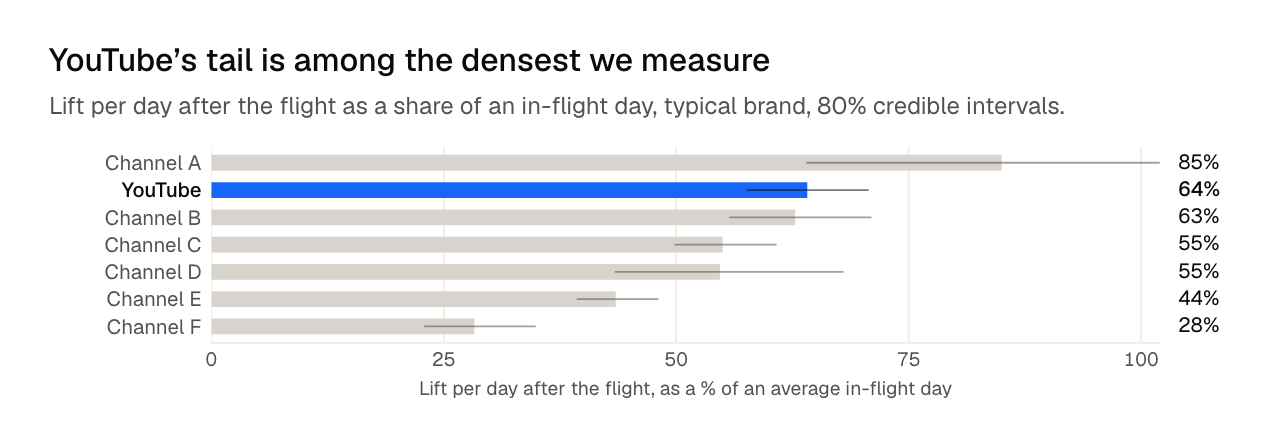
Against everything else you buy, that tail sits near the top. A day after a YouTube flight still books about 64% of an in-flight day’s lift, vs. roughly 30% to 65% for most other channels. Within the same brands, YouTube’s per-day tail runs about 1.2x their other channels.
Awareness pays later, so give it the longer clock
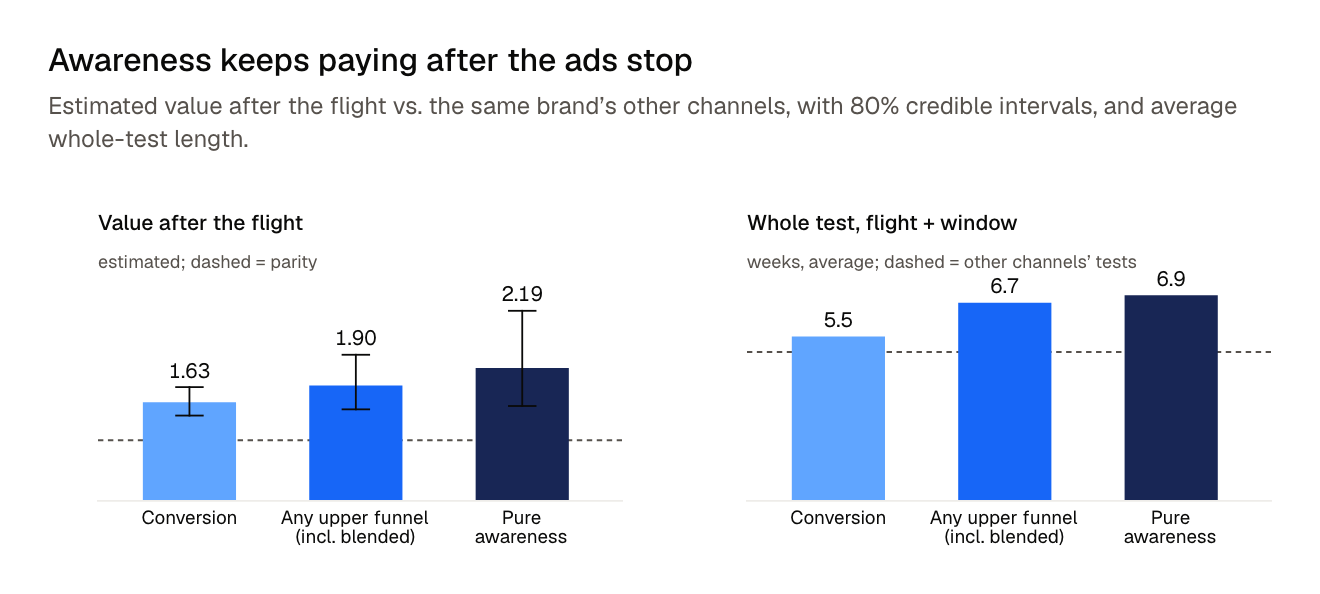
Our TextNow case study is an awareness story and it’s an easy one to miss: On a normal-length sales read, awareness usually trails the brand’s other channels, because most of its impact hasn’t landed yet. Count what lands after the flight, and the picture changes. The more upper-funnel the campaign, the more of its value lands after the ads stop: an estimated 1.6x the brand’s other channels for conversion campaigns, 1.9x for anything with an upper-funnel tactic in it, and 2.2x for pure awareness. Upper-funnel tests also get a longer clock: about 6.9 weeks all in for pure awareness vs. 5.5 for conversion. The question TextNow raises is whether that’s enough. If your awareness tests aren’t running quite a bit longer than your Demand Gen tests (about six weeks all in here), you’re probably underselling them.
Demand Gen is still the surer bet for sales, but for a brand with the patience (and the sales channels) to catch a longer tail, awareness has a real role – one that a short read will undersell.
Demand Gen didn’t make YouTube more incremental. It made it easier to prove it’s worth optimizing.
When we wrote the first report, Demand Gen was brand new (promising, but too early to call). Here’s what we’ve learned since: It didn’t lift YouTube as a whole. Leaving out pure awareness the average YouTube test indexed 0.78x of the brand’s other channels before Demand Gen and 0.87x after, which is inside the noise.
What it did was make it easier to find the version of YouTube that works best. In the Demand Gen era, Demand Gen tests land right at parity with the brand’s other channels (0.98x). The other setups trail on sales: 0.68x for blended upper- and lower-funnel and 0.63x for reach and awareness, most of which lands after a normal read. Among brands that ran both, the Demand Gen test came out about 1.4x ahead.
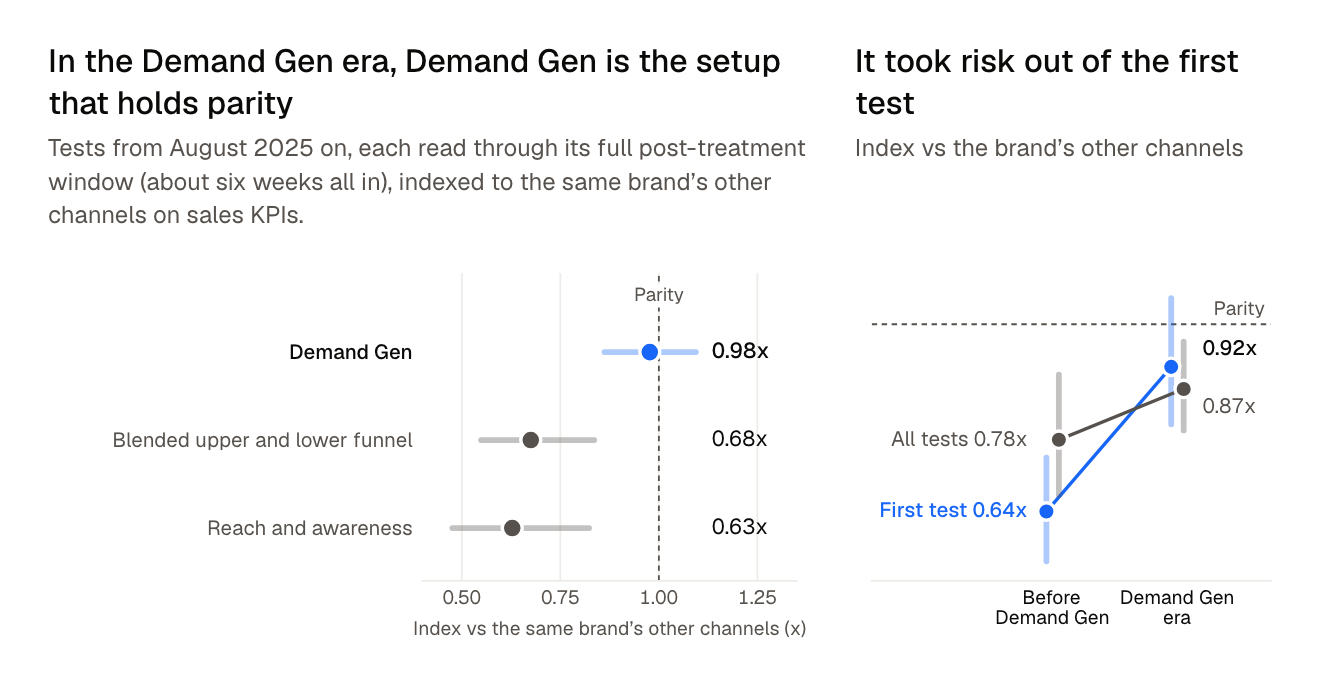
It also took some risk out of trying. A brand’s first YouTube test used to land at 0.64x of its other channels, and in the Demand Gen era it lands at 0.92x. It’s a first test with Haus, not necessarily a brand’s first ever, so read it as directional, but if you shelved YouTube after a rough video action test, the version you’d test today is a friendlier place to start.
Get a solid read, then sharpen your pencil
Back to the question I hear most: “We tested it once, it didn’t work, are we done?” It’s a hard result to walk into a budget meeting with and it usually comes from a smaller bet than people realize. About half of YouTube tests (51%) are built to detect a lift of under 4% on the business, vs. about a third for other channels. That’s a sensible way to size up a channel you’re still learning, but a small bet makes for a less precise read.
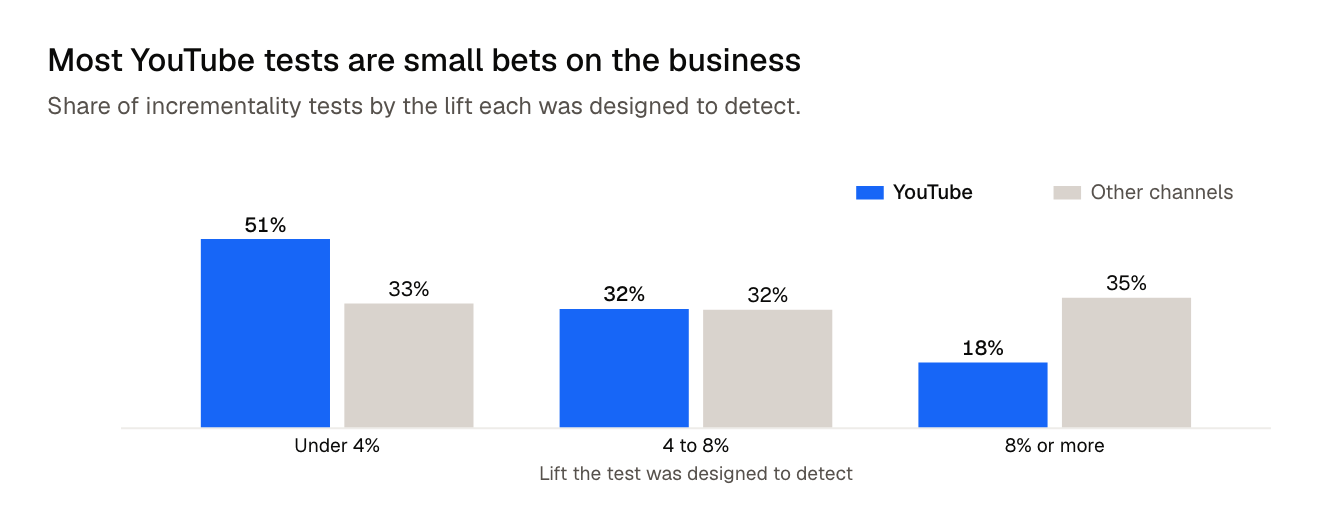
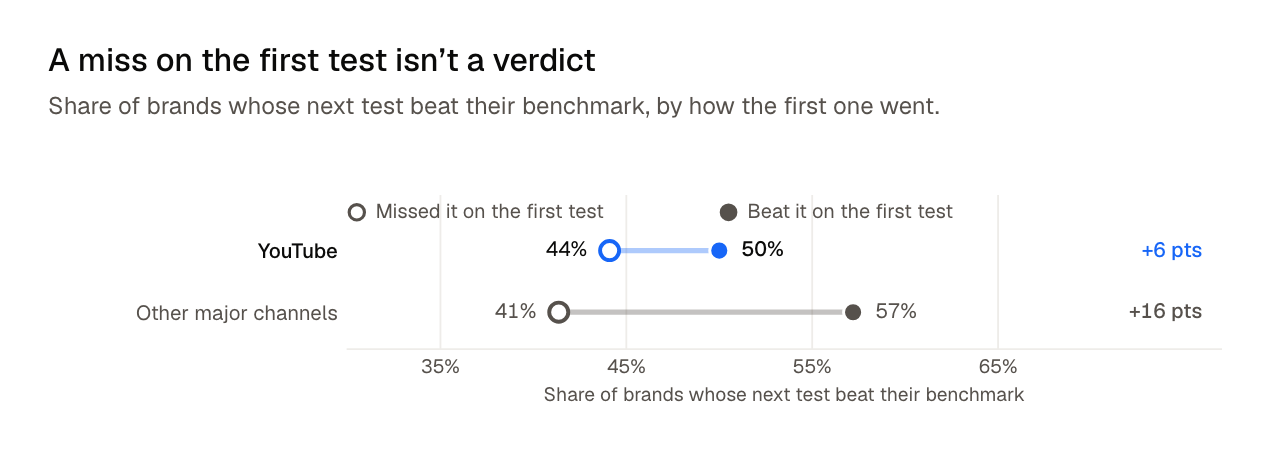
The first result deserves less weight than it usually gets in the room. Brands that missed their benchmark on a first YouTube test beat it on the retest 44% of the time, not far off the 50% for brands that beat it the first time. Some of that is regression to the mean (it shows up on every channel), but the practical read is the same: one test is a read, not a verdict.
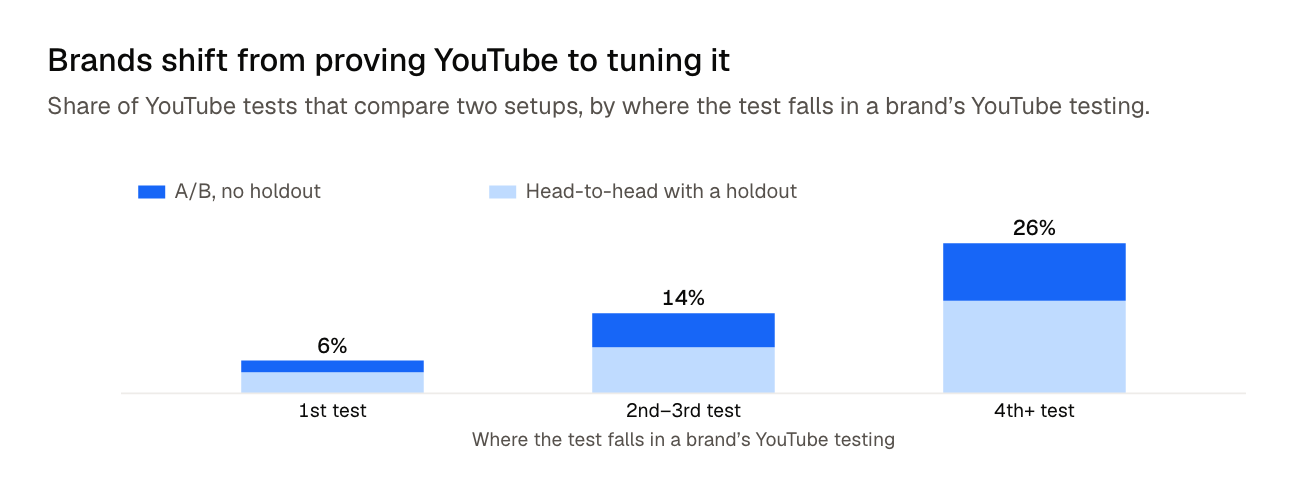
Once a holdout tells you YouTube is incremental for your business, the question changes from whether YouTube works to which version works best, and that’s a job for comparison tests: an A/B split between two creatives, audiences or campaign types with nothing going dark, or a head-to-head with a holdout alongside. That’s roughly how brands already move through it. Comparison tests are about 6% of first YouTube tests and about a quarter (26%) of tests from a brand’s fourth on, and the climb holds within the same brands.
Read any of those results the way you’d read a business bet: What’s the probability it clears your efficiency threshold or beats the setup you’re running now? On a newer, smaller line item, a solid chance can be plenty to act on. Then reserve the holdout for when something big moves (a real change in budget, in your media mix, or in where your customers buy), which is exactly when last year’s baseline stops being yours.
How I’d run YouTube now
The usual disclaimer applies harder than normal: there’s no such thing as a similar company in growth marketing, and none of the numbers above are yours. But if you have a YouTube result in front of you, or you’re about to get one, here’s what I’d do.
1. Don’t grade YouTube on platform reporting: Geo test it, and expect something like 2.3x what Google Ads shows on your site alone.
2. Measure everywhere you sell: If Amazon or retail is part of your business, a DTC-only KPI grades YouTube on its weakest job.
3. Give every test its full post-treatment window: About a quarter of the payoff lands after the ads stop, whatever you bought. Read a test the day the flight ends and you’re grading YouTube on three quarters of its return.
4. Match the setup, and the clock, to the job: Demand Gen is the surer bet for sales on a normal six-week read. Awareness can drive real conversions too (TextNow’s did), but plan it to run much longer than your Demand Gen tests before you judge it.
5. Read results against your threshold, not a pass/fail line: The question that should move budget is the probability YouTube clears your breakeven or marginal cost on scaled channels, not whether the 80% confidence interval clears zero lift.
6. Then spend most of your testing on making it better: Once you have a baseline, do what mature testers do: A/B test creative, audience and campaign type, and bring back a holdout when your budget, mix or business shifts.
Clear all of that and if YouTube still loses to a better use of the money, that’s a real answer – acting on it is the whole reason we test.
The part where I admit my bias
I’ve written before that I have an instinctual belief in YouTube, which is a slightly embarrassing thing for a measurement person to say out loud. It’s the kind of statement that gets you gently asked whether you’ve considered looking at the data.
I have. That’s more or less the whole job. This time I looked at a lot more of it, and I went in half expecting to write a correction.
Part of this is one. A couple of our 2025 numbers shifted. But the core of it holds: YouTube does more than your dashboard shows, a lot of it lands somewhere other than your website, and a real share of it shows up after you’ve stopped tracking.
What the data keeps telling me is that the instinct wasn’t wrong so much as impatient. YouTube doesn’t reward conviction, and it definitely doesn’t reward throwing money at a hunch. It rewards widening the scorecard, waiting out the tail, pointing the campaign at the outcome you actually want, and then testing your way to a better version of it. Nobody has ever been promoted for that. It’s just how you earn it.
If you’re a few tests in and quietly wondering whether you’re the problem, the brands who eventually cracked this mostly looked exactly like you do right now, minus a few more swings.
If you want to know where YouTube sits for your business rather than for the median advertiser, that’s the kind of question a Haus test is built to answer and we’d love to help.
Until next time, I’ll be over here watching a 30-second pre-roll all the way through. For research…
Subscribe to our newsletter
Article tags
Article authors

Tyler is Head of Strategic Insights at Haus. With a decade of experience in marketing, he has spoken at The Lead Innovation Summit and Google’s Rethink ROI, and has authored numerous reports on marketing measurement.


.jpg)

.png)








.avif)
.avif)

.avif)
.avif)
.avif)
.avif)
.avif)


.avif)


.avif)


.avif)
.avif)
.avif)
.avif)
.png)
.png)
.avif)


.avif)
.avif)
.avif)
.avif)
.avif)
.avif)

.avif)

.avif)

.avif)

.avif)
.avif)
.avif)
.avif)
.avif)


.avif)
.avif)
.avif)
.avif)

.avif)
.avif)
.avif)

.avif)

.avif)
.avif)
.avif)
.avif)

.avif)


.png)
.avif)



.avif)
.avif)
.avif)

.avif)
.avif)
.avif)
.avif)
.avif)
.avif)