High Demand, Higher Stakes: Measurement During Peak Season
In this guide, we outline a better way to plan, test, and measure marketing during peak demand periods.

Jul 9, 2026
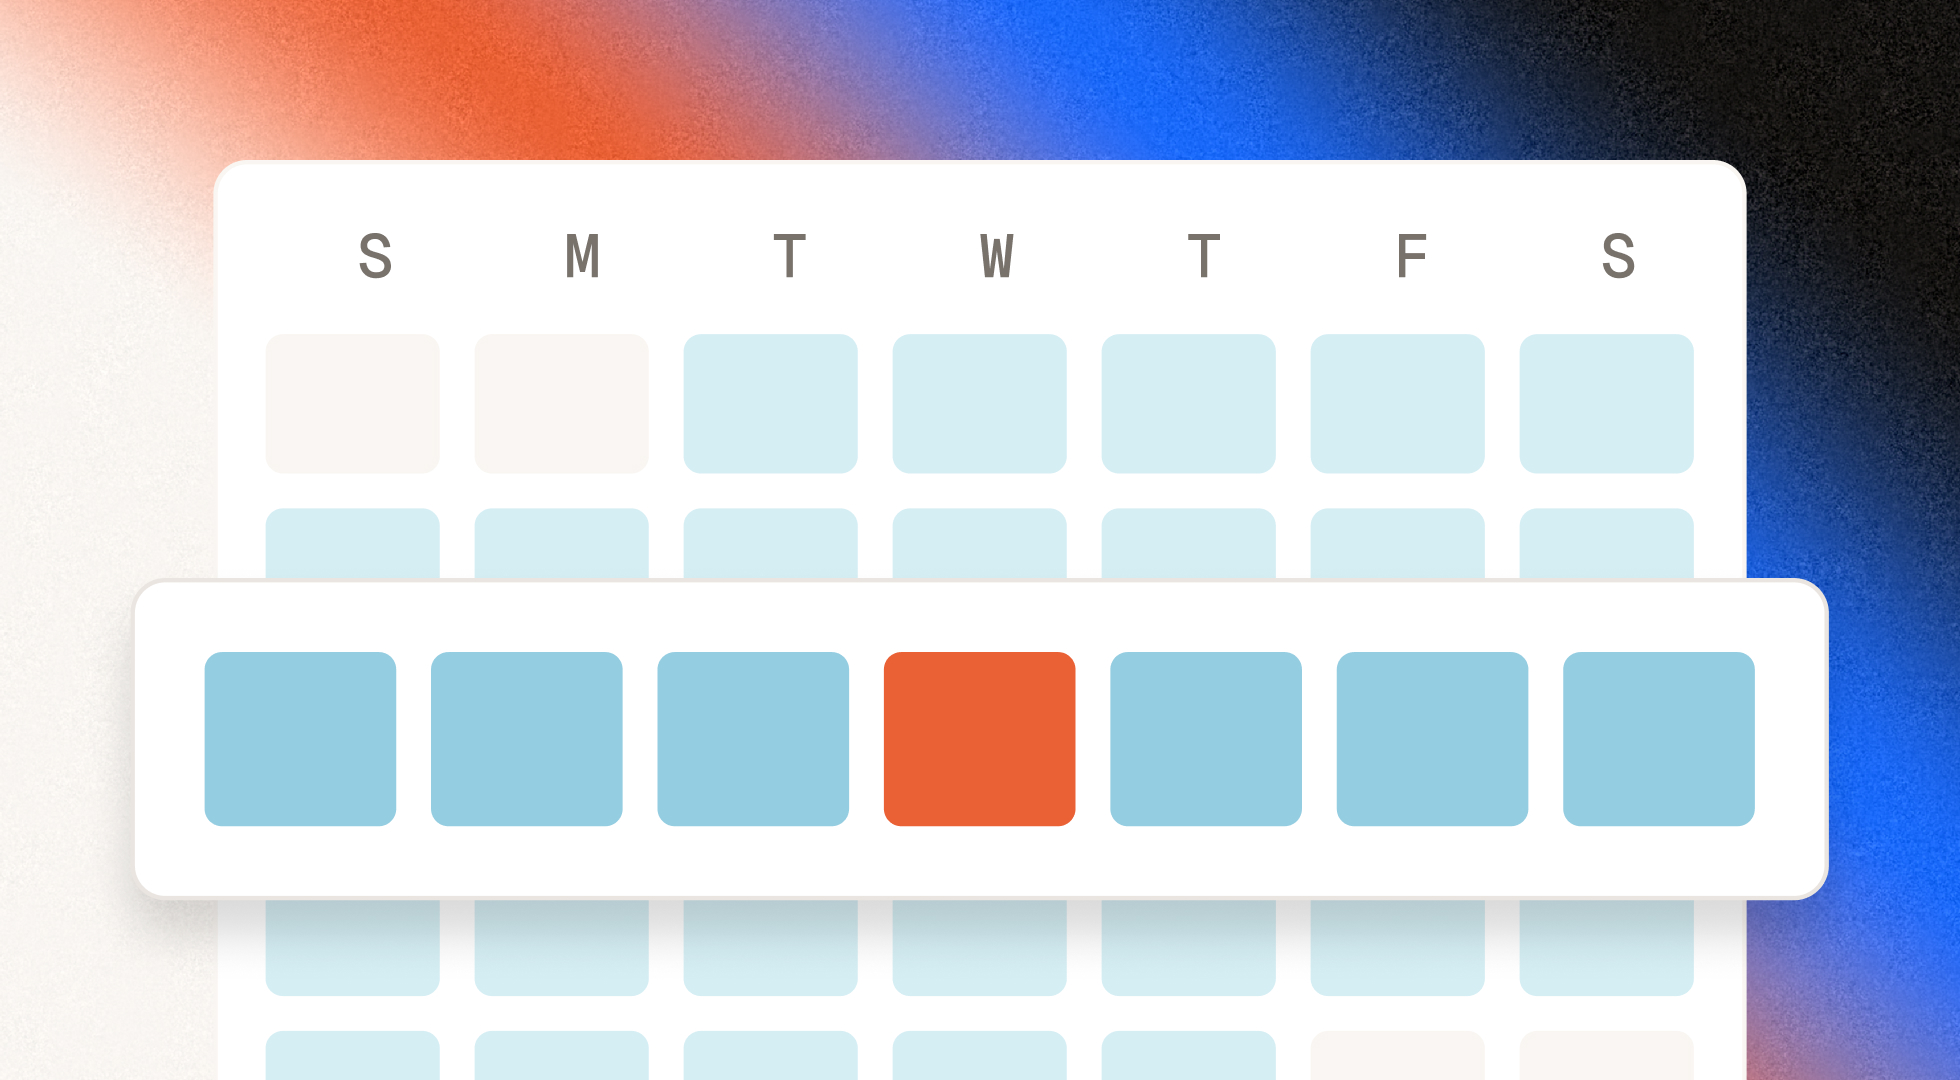
The World Cup. Black Friday and Cyber Monday. Summer box office. New Year, New Me. Tax season. Every industry has its own version of the same thing: high-stakes seasonal moments that marketers spend all year building toward — and that leadership will later scrutinize under a magnifying glass.
These periods are the most important for the business, but they are also the hardest to measure clearly. Auction dynamics swing as competition heats up. Creative, offers, and channel mixes look very different in-season than out of season. Yet much of the industry's measurement still treats weeks as interchangeable and a dollar of media as equally effective year-round.
For teams stewarding tens or hundreds of millions of dollars in marketing budgets, that's no longer acceptable. The question isn't whether seasonality matters. It's whether your experiments and models are explicitly designed to account for it — and whether your organization has built enough confidence in those methods to act on them when the stakes are highest.
Why you can't avoid testing during seasonal periods
Many organizations, implicitly or explicitly, adopt a rule: don't test during our busy season. We get it — holding out a chunk of your marketing during your most revenue-critical weeks feels risky and the opportunity costs feel high. The fear of missing out on revenue is real. But in practice, that rule guarantees you'll never learn how your marketing actually behaves when the stakes are highest.
Seasonal and tentpole moments often drive a disproportionate share of annual revenue, and they're also when the underlying conditions shift the most. Consumer demand, price sensitivity, and competitive intensity are all in motion, and media buying conditions move right along with them.
Ritual learned this firsthand with TikTok. An initial incrementality test showed that the channel was driving no lift at all, which was surprising given the platform's audience. Rather than write TikTok off, the team changed their approach and re-tested during a period of greater demand, adjusting their optimization settings and refreshing creative to match. That single shift — testing when demand was actually elevated, rather than waiting for a quieter week — took TikTok from no measurable lift to an 8% increase in incremental subscriptions. Had Ritual tested only during slower periods, they would have concluded that the channel simply didn't work.
That's the risk of avoiding your critical windows: it's not just that you miss out on learning, it's that the learnings you do have can actively point you in the wrong direction.
And in enterprise organizations, that risk compounds: wrong conclusions influence bigger budgets, shape more teams' decisions, linger longer in planning cycles, and become much harder to unwind once they are embedded in the business.
Overcoming the nerves: Ways to minimize opportunity costs
We understand that testing during these big moments might feel scary. But we've helped hundreds of brands work through exactly this tension, and we can share a few ways to mitigate those fears and manage the opportunity cost.
Smaller holdouts address the most common psychological barrier to in-season testing: the fear that a large control group means leaving too much revenue on the table. With careful sampling and modeling, experiments can be designed with holdouts as small as 5–10%, preserving statistical rigor without pulling an uncomfortably large share of revenue-critical regions out of market.
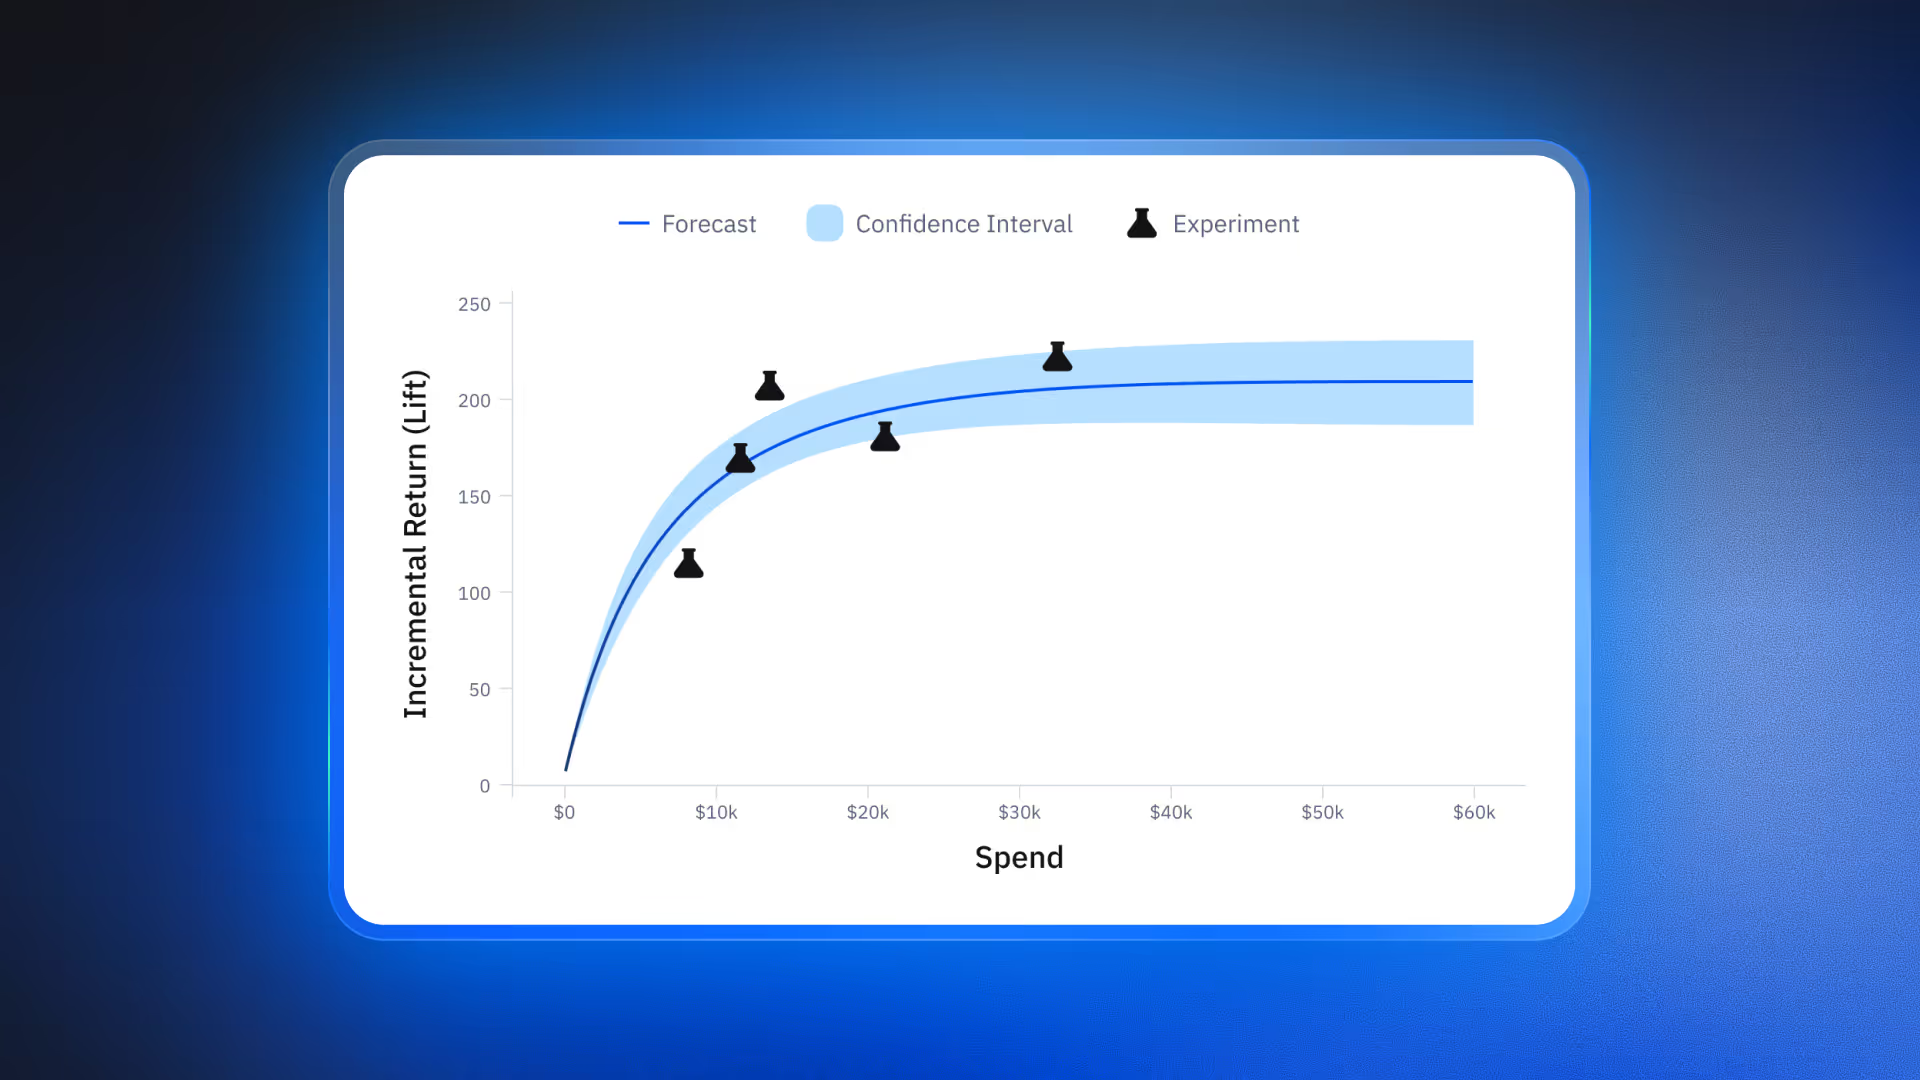
Spend-level tests are another option when even a small holdout feels too costly. A studio on the cusp of a major film release, for example, may be unwilling to go dark — turning off marketing entirely — in any region. In those cases, you can run a different kind of experiment with no explicit holdout at all: one group of markets simply receives a deliberate budget increase relative to a well-matched baseline. It won't tell you the incrementality of a channel, but it can reveal diminishing returns or a case for investing more efficiently.
These tools give teams a flexible design toolkit for seasonal moments. Instead of a binary choice between "run a textbook experiment" or "don't test at all," you can choose the structure that fits the question you're trying to answer, your organization's risk tolerance, and what you can realistically learn in a given window.
Methodological considerations for designing high-season experiments
Once you're ready to test during these moments — and you should be — the real question becomes whether your measurement platform can actually deliver results you trust. During periods like the NFL season or Black Friday/Cyber Monday, demand is elevated, markets get noisier, and the cost of misreading performance is much higher. The goal isn't just to run a statistically valid test, it's to run one that produces a result you can act on when making decisions about budget allocation, forecasting, and channel strategy.
That is where methodology matters. A strong high-season design should account for how demand behaves during peak periods, how treatment and control are compared, how markets are balanced, and how volatility is handled when the unexpected happens.
These four principles are what separate a seasonal read you can act on from one that quietly misleads you. If you're vetting a measurement partner, it’s worth pressure-testing their approaches:
- Historical Calibration of Power: Ask what "normal" your test is actually being measured against. Power assumptions — how much lift you'd expect, how noisy the KPI is, what the test can realistically detect — are usually set once and left alone. If those assumptions come from a quiet month but the test runs during your busiest one, you're comparing peak-season results to an off-season yardstick, and the read is wrong before the experiment even starts. The fix is to pull power assumptions from comparable seasonal history instead of a generic average — though that gets harder the rarer the moment. A World Cup cycle doesn't give you a new one every year to learn from; you get one every four, which means the lookback window has to be built deliberately rather than assumed. At Haus, we refresh those assumptions from your real KPI behavior every six weeks by default, and you can customize the lookback window to periods that actually resemble the one you're testing in — including ones several years back, if that's the closest analog available.
- Synthetic Controls: Ask how the counterfactual is built. A weak design compares treatment markets to a handful of "similar" control markets and hopes they behave the same way. A synthetic control sidesteps that entirely by blending many control markets into a single modeled comparison group, tuned to track the treatment group's actual behavior in the pre-period — so during the test window, you're checking for a real divergence from an expected path, rather than needing one perfectly matched market to exist in the first place. That distinction is what lets you separate true marketing impact from the seasonal noise every market experiences anyway.
- Stratified random sampling: Ask how they select their treatment and control. Large urban markets swing harder during peak periods — sharper auctions, more promotional noise — than smaller, steadier ones. A design that ignores this can let a few chaotic markets speak for the whole test. Stratifying markets by activity and profile before randomizing treatment and control keeps that from happening, so the result reflects the full portfolio, not just its loudest members.
- Volatility and outlier management: Ask what happens when something breaks mid-test, because during peak season, something usually does. A massive storm, inventory constraints, a competitor's stunt in a key market — any of these can distort an experiment result if nobody's watching for it. The difference between a program you can trust and one you can't is whether anomaly detection is built into the methodology from day one, or bolted on after a result looks strange. Treated as part of the design, it's what keeps one bad week from being mistaken for the truth.
These are not special safeguards reserved for peak-season testing; they are foundational parts of how Haus designs experiments across the board, which is exactly why high-season tests can still be run with confidence.
Operationalizing seasonal experiment results
Even with well-designed seasonal experiments, senior leaders quickly run into a second challenge: how to apply those insights to plan for the future.
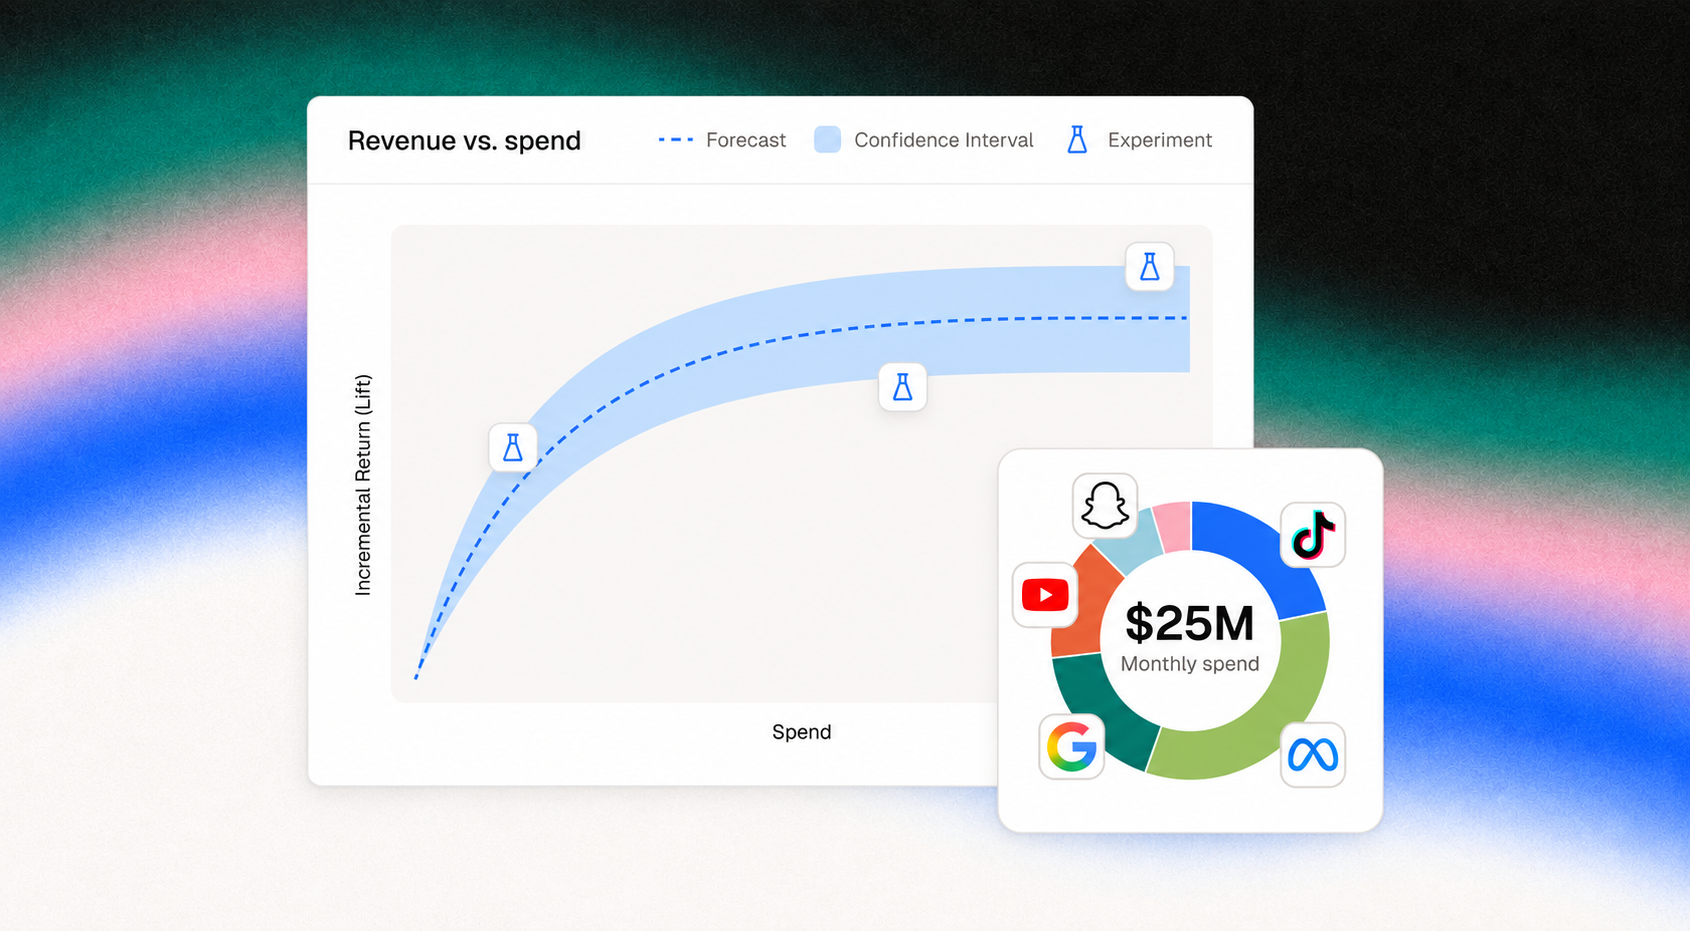
This is typically when brands turn to marketing mix models (MMMs), and in most MMM, each channel has a single, stable response curve. Seasonality is applied at the baseline level: the model expects more sales in November than in February, but it still assumes each incremental dollar of media is equally effective year-round.
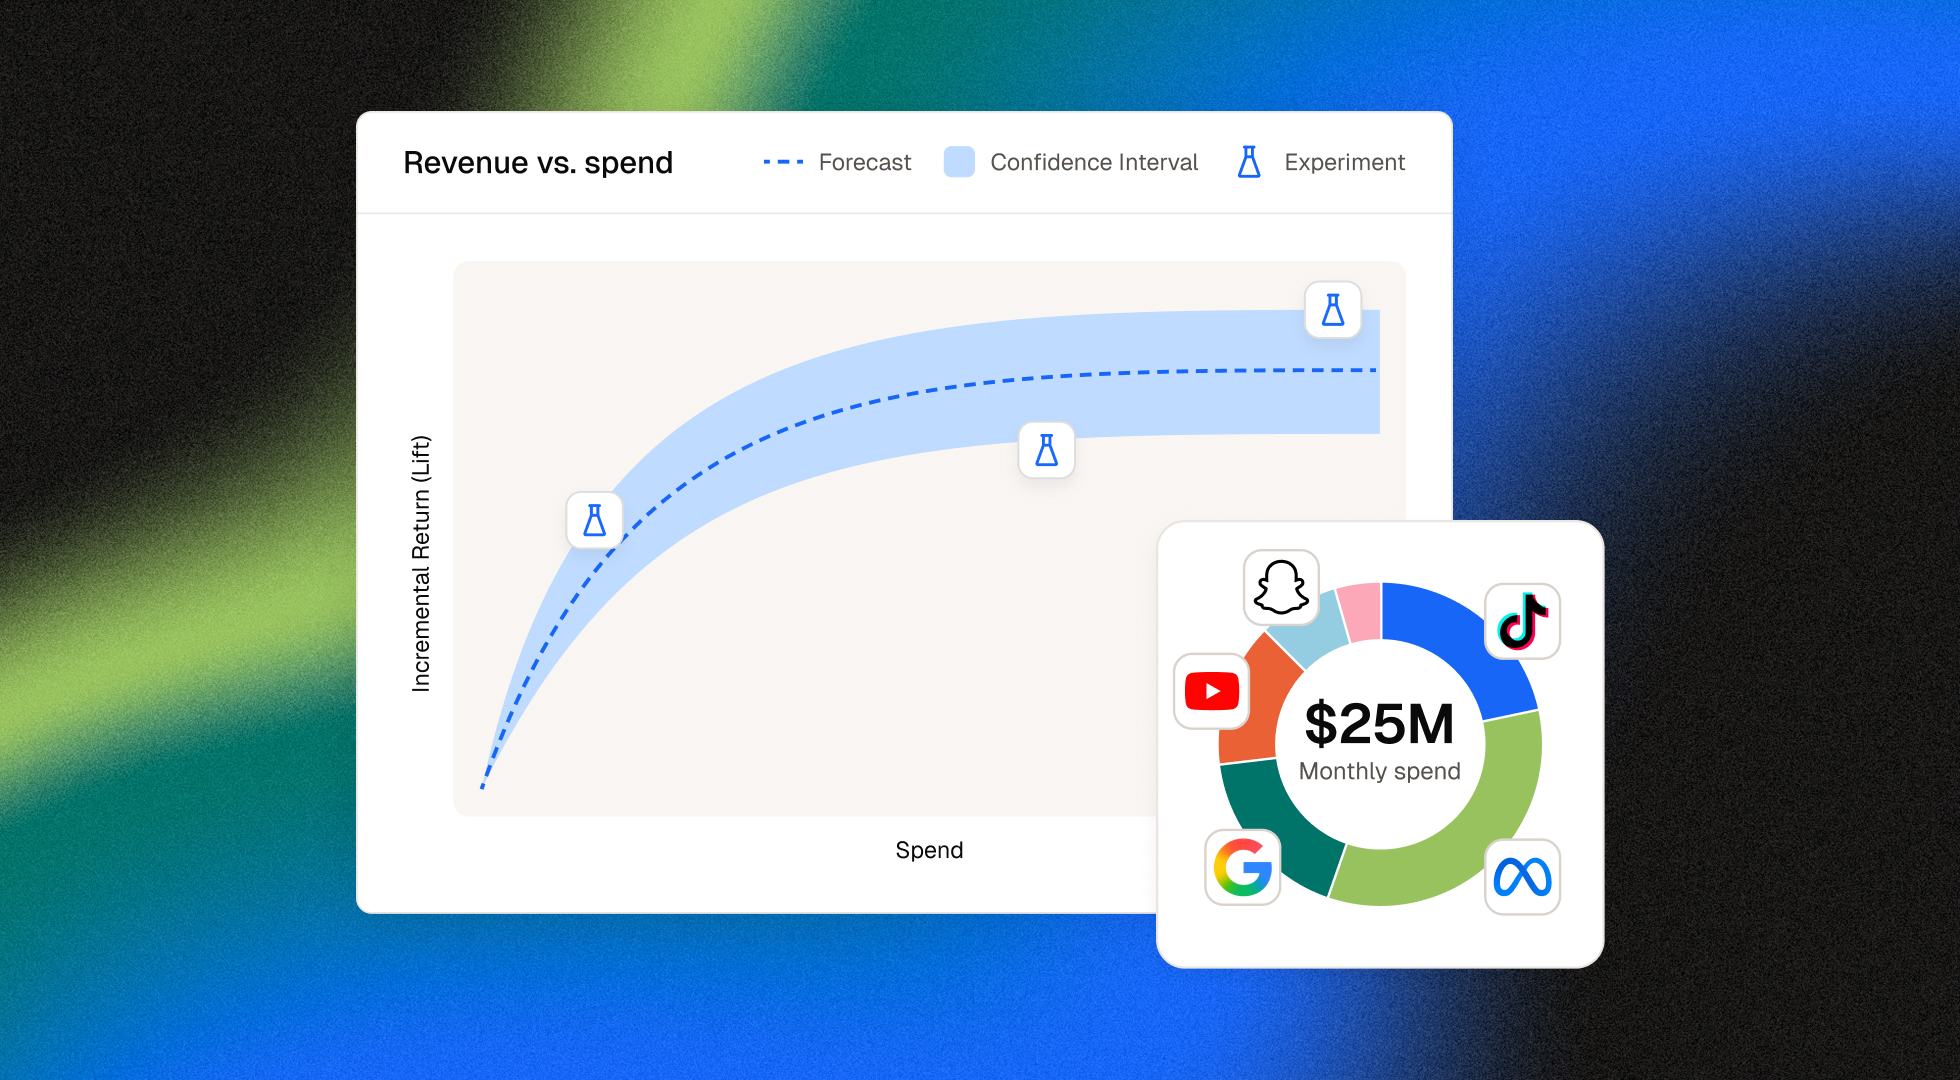
A more advanced approach lets channel efficiency itself vary over time, moving from "one curve per channel" to "one curve per channel, modulated by a factor that changes over time." Instead of asking what a channel's ROI is in the abstract, you ask what its ROI is in this period, under these conditions.
In Haus's Causal MMM, this is implemented through time-varying return curves. For each channel, the model fits a daily efficiency factor — a multiplier that reflects how much harder or easier it is to buy incremental results on a given day relative to the long-run average. When the factor is above one, media is performing better than typical; when it's below one, auction dynamics or consumer behavior are working against you.
These factors are driven by your actual business calendar. The model learns from day-of-week patterns, holiday windows, promotional periods, and other observable structures in your data. They're normalized so their mean is one across the training window, which keeps them interpretable as relative efficiency rather than a new opaque metric.
From a planning perspective, this gives you a principled way to translate experimental results across time. An experiment on TikTok may be perfectly valid for the period it ran, but in a different season, the model recognizes that efficiency historically shifts. The return curve you see for the holiday window already reflects that expected change — not because the experiment was wrong, but because the environment is different.
For an apparel company with big seasonal and promotional moments, time-varying return curves are especially valuable because they capture changes in ad efficiency over time, not just swings in total demand.
By dynamically weighting experiments and reflecting the impact of promos and launches, Causal MMM gives the team a more representative view of what’s working in the current planning window and makes seasonal budget decisions more trustworthy.
A system for seasonal decision-making
Marketers don't shy away from advertising during big moments because they're hard. These are the moments when teams lean into bold ideas and calculated risk because the upside is worth it. Measurement infrastructure should be built to the same standard.
These are the periods brands most need to understand. They're where budgets are most concentrated, where leadership attention is most intense, and where the gap between an assumption and a causally grounded truth is worth real money. Avoiding experimentation or relying on calendar-agnostic models in those windows doesn't reduce complexity — it just defers it into next year's planning cycle.
The opportunity is to build an experimentation program and measurement infrastructure that's just as comfortable operating out-of-season as it is in-season. When those pieces are in place, a World Cup cycle, Q4, playoffs, and every other seasonal challenge stop being exceptions to tiptoe around and become the moments where you're most confident in your decisions.


.jpg)

.png)








.avif)
.avif)

.avif)
.avif)
.avif)
.avif)
.avif)


.avif)

.avif)

.avif)
.avif)
.avif)
.avif)
.png)
.png)
.avif)

.avif)
.avif)
.avif)
.avif)
.avif)
.avif)

.avif)

.avif)

.avif)

.avif)
.avif)
.avif)
.avif)
.avif)


.avif)
.avif)
.avif)
.avif)

.avif)
.avif)
.avif)

.avif)

.avif)
.avif)
.avif)
.avif)

.avif)


.png)
.avif)



.avif)
.avif)
.avif)

.avif)
.avif)
.avif)
.avif)
.avif)
.avif)