Is Your Marketing ROI Real? A Brief History of Scanners and Sales
When brands cut prospecting to chase ROAS, they stop replenishing future demand – and history illustrates what happens next.
Apr 13, 2026

You’ve had the conversation. Sitting in a budget review, someone pulls up your platform ads manager – 3.8x ROAS, CTR up, CPMs holding. And yet the room has a question nobody can quite articulate: Why does acquiring a new customer keep getting more expensive if the performance is this good?
For direct-to-consumer (DTC) brands, customer acquisition costs (CAC) have climbed steadily and significantly throughout the 2020s – driven by rising platform costs, signal loss, and intensifying competition for the same high-intent audiences. And yet most brands' platform dashboards – reporting on metrics like return on ad spend (ROAS), click-through rate (CTR), and conversion rates – continue to reflect what look like healthy, efficient campaigns.
That disconnect between what the platform reports and what the business actually experiences is not a glitch. It is the most consequential measurement problem in modern marketing. And it has a unique historical precedent worth understanding.
Hard data has destroyed iconic brands before
In the late 1970s, supermarket barcode scanners arrived and quietly destroyed some of the most iconic brands in American consumer goods. Before scanners, consumer packaged goods (CPG) brand managers waited up to two months to see sales data. They managed on instinct, brand strategy, and long-horizon thinking. Advertising budgets were large. Trade promotions were modest.
Then scanner data made promotional lift immediately visible. A brand manager could pull a Monday morning report and see, in precise detail, exactly how many units moved during last week’s end-cap display. The lift was enormous. The attribution was instant. The return on investment (ROI) felt airtight.
So brands did what any rational organization does when they suddenly have hard data: They followed it.
Between 1978 and 2001, trade promotion spending more than doubled as a share of marketing budgets, from 33% to 61%. Advertising, whose long-term effects were real but difficult to observe in a weekly spreadsheet, fell from 40% to 24%. The reallocation felt justified by every number on every dashboard.
What it actually did was quietly hollow out the demand foundations of an entire generation of brands. Price elasticities crept upward. Consumers learned to wait for deals. Baseline sales – the revenue you’d generate without any promotion at all – declined quarter over quarter in ways no promotional lift report ever captured. For example, pickle company Vlasic followed this playbook faithfully, and ultimately went bankrupt. Conversely, a brand like Patagonia bucked the trend: They invested in brand equity over short-term promotional returns, and their customers purchased at full price – without waiting for a deal.
Wharton's Len Lodish and Duke's Carl Mela documented the mechanism precisely: Managers manage by the data they have, not the data they need. In the example above, the data Vlasic had made promotions look like the smartest decision in the room, every single quarter, right up until the brand collapsed.
What’s the marketing measurement data brands need?
The scanner is now a pixel. The promotional report is now platform reporting. And in April 2021, a single software update did to DTC brands what supermarket scanners did to CPG in the 1980s – it just happened in a quarter instead of a decade.
When Apple introduced App Tracking Transparency in iOS 14.5, pixel signal deteriorated significantly across the industry overnight. Meta responded by shortening the default attribution window from 28-day click to 7-day click, shifting to modeled conversion data, and steering brands to optimize for the conversion events the platform could still observe.
The rational response to losing signal was to lean harder into the signal that remained. Brands shifted budget toward conversion-optimized campaigns. Upper-funnel spend – like YouTube awareness, broad TikTok reach, and Meta prospecting – got cut first because it was hardest to attribute under the new constraints.
The return on ad spend (ROAS) looked great. But there’s a structural problem buried within platform dashboards: The platform is grading its own homework and doesn’t see what other platforms are taking credit for.
Meta’s revenue model relies on advertising spend. When it reports a 4.2x ROAS on your conversion campaign, it is calculating that figure using its own attribution methodology, applied to events in its own ecosystem, reported through its own interface. Google does the same. TikTok does the same. And on, and on. When both Google and Meta claim credit for the same conversion – a user saw a Meta video, then searched on Google, then converted – neither platform surfaces that conflict. You see two separate wins.
This is not a conspiracy. It’s structural misalignment between who owns the measurement tool and who benefits from the result. Across the geo experiments Haus has run on behalf of DTC brands, we consistently find that platform-reported ROAS overstates true incremental returns on retargeting-heavy campaigns. The number you’re optimizing against is real – it’s just not telling you what you think it is. And no amount of reallocation within that same system will fix it.
Awareness spend seeds future demand
This paradigm tends to appear only in retrospect, usually when growth stalls and no one in the room can explain why.
Here’s what’s often happening beneath the numbers: Awareness spend seeds future demand. When you cut prospecting to fund higher-ROAS retargeting, you stop replenishing the pool of potential customers your conversion campaigns are harvesting. The pool thins. Cost per 1,000 impressions (CPMs) rise – not only from market inflation, but from your own saturation of your most valuable segments. Meanwhile, rising acquisition costs get misdiagnosed as a creative problem. You refresh creative, numbers improve briefly, then slip again. That’s not creative fatigue – a problem solved by making new ads. That's audience exhaustion – you've saturated the available pool of high-intent buyers. The masking effect makes it worse. Your existing customers are still buying. Blended ROAS holds. But new customer acquisition – the metric that determines whether your brand will be larger in two years – is quietly stalling. The health check looks fine because the patient is living off old muscle mass. And any attempt to test your way out of it runs into a methodological trap: Awareness campaigns evaluated on 7-day ROAS windows will always look like they’re failing. If a new customer takes 45 days from first exposure to first purchase – common in higher-consideration DTC categories – a 7-day window registers that investment as zero. You’re not running a fair test.
The downstream consequence is strategic. Without causal evidence that brand investment is working, there’s no way to defend rebalancing toward awareness in a P&L-driven planning cycle. The performance marketing ceiling isn’t just a CMO problem, but a measurement problem that blocks the finance conversation entirely.
These patterns have converged across the DTC category – brands that built massive audiences on the back of cheap, measurable performance channels and ran into the same ceiling. Growth stalled. Profitability disappeared. The data showed everything was working right up until it wasn’t.
Why traditional measurement stacks can’t fix this
Third-party multi-touch attribution (MTA) platforms have made genuine strides in synthesizing cross-platform data. They’re meaningfully more honest than most platforms’ self-reporting. But traditional MTA is still a correlation engine, not a causal one.
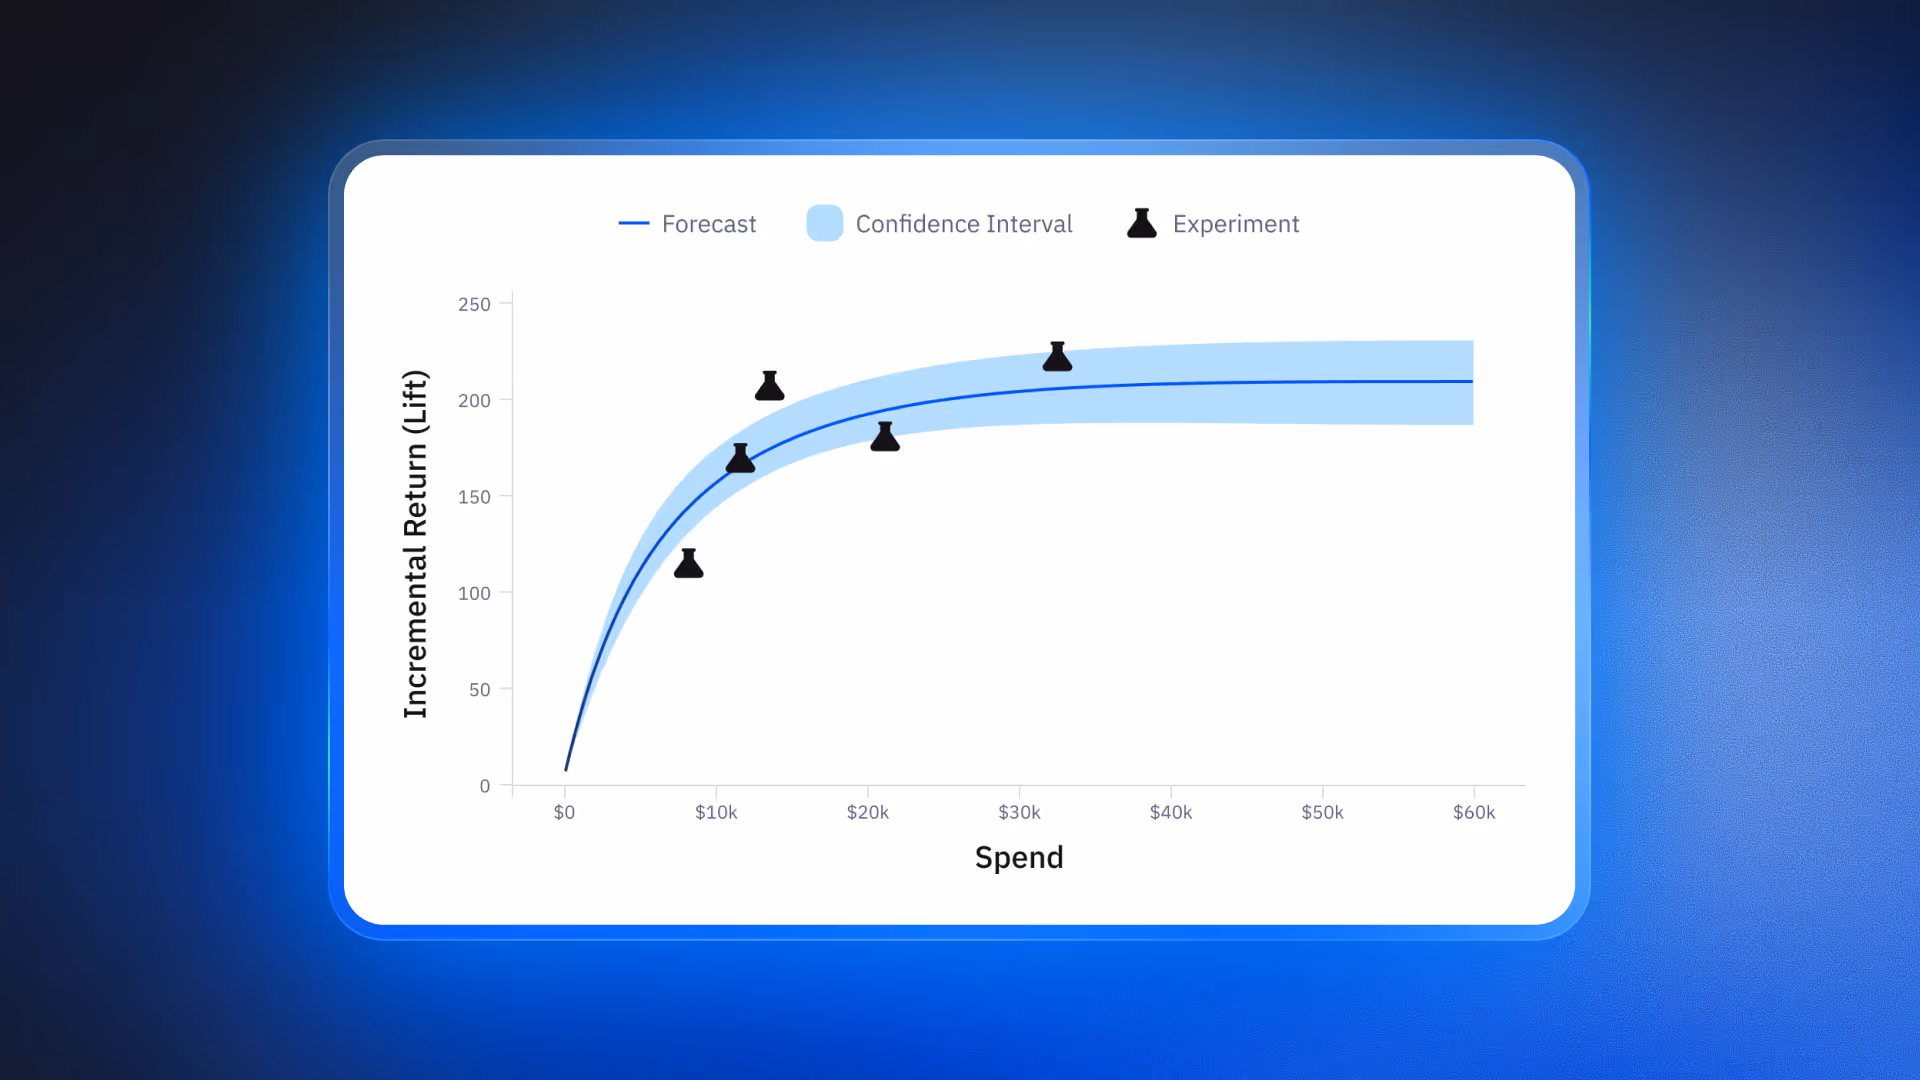
Here’s what that distinction means in practice: Your traditional MTA tool might report that retargeting drives a 3.8x ROAS. A geo holdout on the same retargeting campaign – going dark across carefully selected treatment and control regions – routinely shows that 40–60% of those conversions would have happened anyway. Those customers were already in-market and would have found their way to checkout without the ad. The attribution model observed the touchpoint and said it caused the conversion. It didn’t.
The inverse is equally true: Awareness campaigns whose effects surface 30–60 days post-exposure will consistently underperform on any attribution window shorter than that effect cycle. You’re not seeing that investment fail. You’re seeing your measurement system fail to capture it.
Traditional marketing mix models (MMMs) have the right intuition – aggregate data, long time horizons, channel-level read – but when run as annual retrospective projects, they’re too slow for in-flight decisions and too static for the pace at which DTC media dynamics shift. Correlation-based tools will always systematically overfund the measurable and underfund the unmeasurable, regardless of how many data sources they ingest.
What brands can achieve when they run the right marketing measurement strategy
“The most common thing we see when a brand runs their first geo holdout on retargeting is that they’ve been paying for customers who were already coming. Once you see that number, you can’t unsee it – and you suddenly have budget to deploy into the channels that are actually building your future demand,” explains Haus Measurement Strategist Shyloh Mahy.
This is the difference between correlation and causation in practice. It’s not a philosophical distinction; it’s a budget decision. The brands running causal measurement programs are making allocation decisions based on what’s actually working. The ones that aren’t are running the wrong experiment with the wrong instruments and wondering why the results keep disappointing.
Three questions to bring to your next budget meeting
If the Lodish and Mela prescription was “track your baselines,” the DTC equivalent is learning to ask three questions that your current marketing measurement reporting stack almost certainly can’t answer – and that every budget conversation should be built around:
1. What is our true incremental ROAS on each channel – not what the platform reports?
This requires a geo experiment. Haus data shows the answer is often lower than platform-reported ROAS on retargeting-heavy campaigns, and often higher than platform-reported metrics on upper-funnel channels that attribution windows systematically undercount.
2. Is our baseline demand growing or shrinking?
Strip out all paid activity. What would your revenue look like on zero incremental marketing? If that number is declining quarter over quarter, your brand is being depleted even while your performance campaigns look efficient. This is the leading indicator that precedes the growth ceiling – and it’s invisible in platform reporting.
3. What would happen to our CAC in 12 months if we reallocated 15% of retargeting budget to prospecting today?
This is a Causal MMM question, not an attribution question. Brands with this capability can run that scenario in a planning session. Brands without it are guessing, and typically guessing wrong in a direction that favors the channel they already know how to measure.
These aren’t research questions for an annual retrospective. They should be live numbers in every budget review.
See the impact of your marketing measurement strategy in your bottom line
The brands that survived the scanner era survived because they refused to let their brand be managed by the metric that was most visible. Instead, they invested in advertising when the data said advertising was hard to justify. They built relationships with their customers and acted in the interest of something bigger than themselves while brands that chased discounted lift ceded their power.
The DTC brands that look closer to Patagonia in 2030 are the ones running the harder measurement program today. Not because they have better instincts about brand investment – most CMOs already believe in the value of awareness – but because they have the causal evidence to defend it in a room full of people looking at a P&L.
The scanner didn't lie, exactly – it just showed brands the part of the story that made the wrong decision look right. But it’s now 2026, and there’s a better way.
Subscribe to our newsletter
Article Tags
Article Authors

Ike is a Measurement Strategy Lead at Haus, a role he’s held since 2024. Before joining Haus, he spent seven years in paid media — first agency-side running performance campaigns for enterprise clients, then leading acquisition in-house at Huckberry, the men’s lifestyle and apparel brand.

.png)
.avif)


.avif)
.avif)

.avif)
.avif)
.avif)
.avif)
.avif)

.avif)


.avif)


.avif)
.avif)
.avif)
.avif)
.png)
.png)
.avif)

.avif)
.avif)
.avif)
.avif)
.avif)
.avif)

.avif)

.avif)

.avif)

.avif)
.avif)
.avif)
.avif)
.avif)


.avif)
.avif)

.avif)
.avif)

.avif)
.avif)
.avif)

.avif)

.avif)
.avif)
.avif)
.avif)

.avif)


.avif)
.avif)


.avif)
.avif)
.avif)

.avif)
.avif)
.avif)
.avif)
.avif)
.avif)


.png)
.avif)
.png)
.avif)