Incrementality: The Fundamentals
Let's explore incrementality from every angle — what it is, what you can test, and what you need to get started.
Oct 9, 2025

It’s your mother’s birthday in a few days, and once again you’ve waited until the last minute to get her gift. Lucky for you, she told you the exact pair of winter boots she wants.
Before you buy these boots, you kill some time on Instagram. As you’re scrolling, you coincidentally see an ad for those exact boots. You take this ad as your sign to stop procrastinating, and you purchase the boots.
Did that Instagram ad convince you to buy the boots? Well, no. If anyone should get credit for that conversion, it’s your mom. But that won’t stop Instagram from taking credit. And it won’t stop the marketer who bought that ad from assuming their marketing is working.
These very moments are the reason more marketers are embracing incrementality testing. Instead of relying on inflated platform-reported attribution metrics, incrementality offers an experiment-driven approach that gets at the true impact of your marketing. That’s because incrementality focuses on causal impact — only measuring moments where your ad caused a customer to convert.
At a time when evolving privacy initiatives are changing the ways growth marketers understand the customer journey, incrementality offers a privacy-durable path forward.
This guide will get you up to speed. We’ll explain incrementality from all angles: what it is, what you can test, and what you need to get started. So let’s dive in.
What is Incrementality?
At its core, incrementality tells us if a change in strategy caused a change in outcome. For instance, did increasing your spend on Meta campaigns cause more conversions?
To provide these answers, incrementality uses the scientific method. You’ve maybe seen a similar process in randomized control trials in healthcare:
- Group A receives a drug (aka the treatment group)
- Group B receives a placebo (aka the control group)
- Scientists track outcomes in both groups. Are Group A’s outcomes drastically different?
Now imagine this from a marketing POV. Maybe you geo-segment your audience so that one part of your audience sees a marketing campaign and another doesn’t. Did the group that saw your campaign convert significantly more often? If so, those are incremental conversions.
As you can imagine, the opportunities for experimentation are nearly endless. Maybe you use incrementality testing to see if brand search is working. Or perhaps you set up a test to optimize your YouTube ad spend. You might find you can spend even less on the channel without sacrificing conversions — leading to major savings for your organization.
Once you get in a rhythm, incrementality testing can be — dare we say — kind of fun? After all, it’s enjoyable learning the true impact of your marketing. And insights from one test can soon inform the next one. And the next one. Before you know it, you’ve fostered a culture of experimentation.
But let’s not get ahead of ourselves. Next, we’ll show you some of the many things you can test.
What Can You Incrementality Test?
If you really wanted to simplify things, a marketer’s job could be split into two tasks: Making decisions… and figuring out if those decisions worked. Incrementality testing helps you with that second task so you can get better at the first.
For instance, say you’re trying to optimize your channel mix. Incrementality testing can help you with the following key decisions:
- Which new channel should we invest in?
- What is the most incremental mix of channels for our brand?
- Are we spending the right amount on each channel?
- How should we reallocate spend during our peak season?
But incrementality tests don’t just help with larger strategic decisions. They also help you answer more granular, campaign-specific questions. For instance, you can test to answer the following:
- Should we include or exclude branded search terms in our PMax campaigns?
- Are UGC or polished brand ads more incremental for our brand?
- What’s the right ratio of top-of-funnel and bottom-of-funnel media?
- Should we prioritize broad-based targeting or intent-based targeting?
You can also test incrementality to get a more omnichannel view of your business:
- Are customers converting on our site, on Amazon, or in retail locations?
- Is our ad spend shifting customers from one sales channel to another?
- What’s the ROI on new sampling, merchandising, and other retail programs?
We’ve just thrown a bunch of tests at you. So to bring it all together, let’s outline an example.
Example: A coffee brand tests to optimize Meta campaigns
Javy Coffee, a fan favorite coffee concentrate brand, was investing heavily in Meta campaigns using Advantage Shopping Plus. Their budget was split evenly between top-of-funnel campaigns that were more video-based and bottom-of-funnel campaigns that relied more on customer testimonials and product shots. Their question: Which campaign type was more incremental?
Javy runs holdout tests for each campaign type
First, Javy set up a simple geo-holdout test for their bottom-of-funnel campaigns. This meant that for two weeks, a portion of their audience didn’t see any bottom-of-funnel Meta campaigns. As the test ran, they tracked Shopify and Amazon orders. Then they did the same for top-of-funnel campaigns — a two-week holdout campaign with Shopify and Amazon orders as the main KPIs.
Cue the shocking results
Remember: Javy was splitting their budget evenly between top-of-funnel and bottom-of-funnel Meta campaigns. So you can only imagine how much they spit out their coffee when they saw that their top-of-funnel creative campaign was over 13x more incremental than their bottom-of-funnel effort.
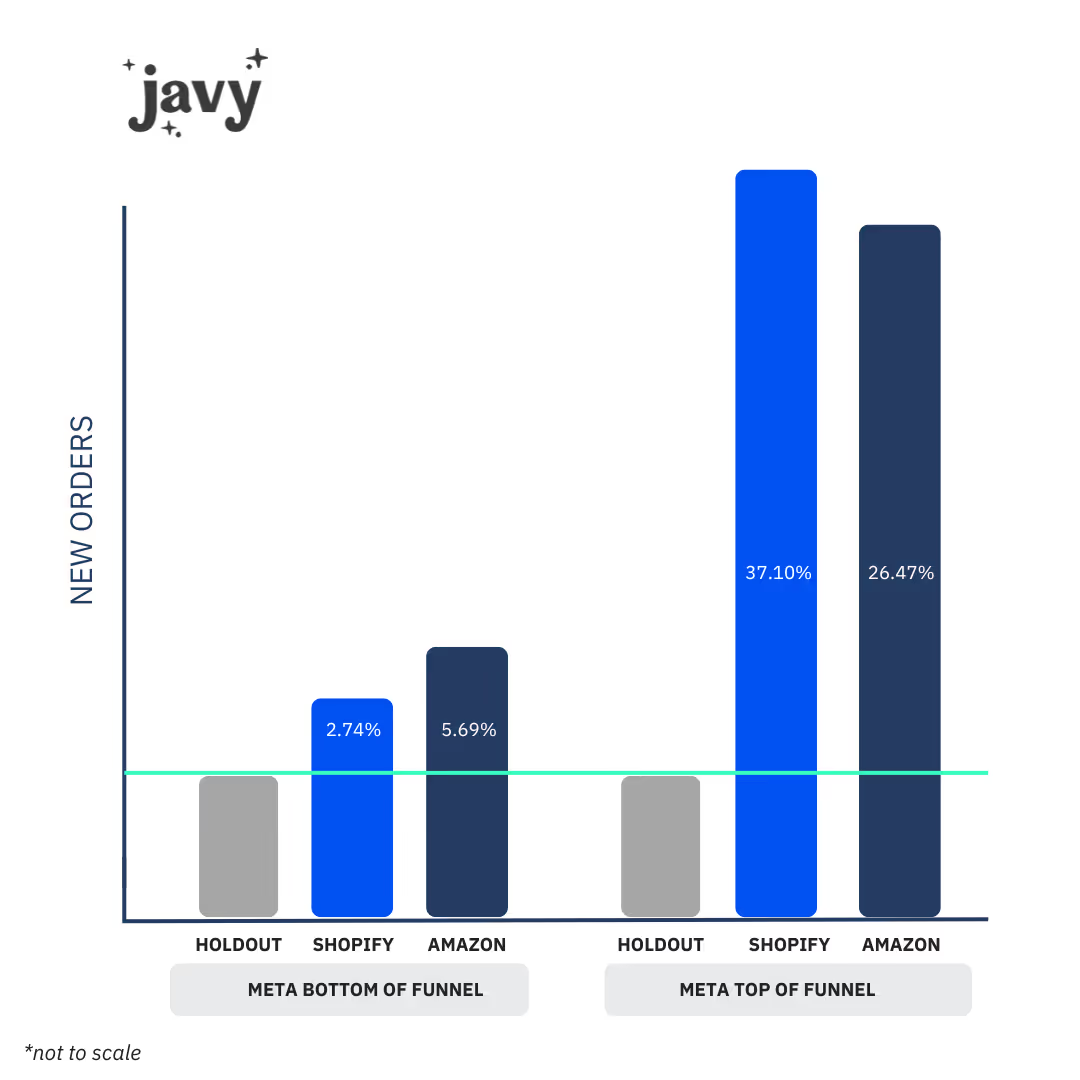
It doesn’t take an over-caffeinated data scientist to figure out what happened next. Javy reallocated the majority of their Meta budget to their top-of-funnel campaign, which immediately improved their customer acquisition cost (CAC) and marketing efficiency ratio (MER). Yep, we’ll raise a cup of joe to that.
When should you invest in incrementality testing?
While any brand can benefit from more informed decision-making, incrementality testing takes time and money. Before you dive head-first into incrementality, consider asking yourself the following questions about your company and its current marketing strategy.
1. Are you spending on more than two marketing channels?
If you’re only spending on one or two marketing channels, it’s probably pretty easy to track how your marketing is affecting your business outcomes. But as you add more channels, the picture becomes more complex, and it becomes harder to connect tactics to impact.
The more channels you’re investing in, the more you need incrementality testing. Experiments can help you drill down on the most efficient spend across existing channels and then get ready to test into new channels.
2. Are you spending more than $1M/month on marketing tactics?
Say you’re just spending on Meta and Google… but you’re spending seven figures there. If so, you need to make sure your spending is efficient on these channels. For instance, maybe an incrementality test shows you can reduce your ad spend by 25% without any drop in conversions.
Or you can get more granular with your campaigns on that pricey channel. Maybe you learn PMax is more incremental when brand terms are included or that upper funnel content drives more conversions. Or maybe you want to test to optimize campaigns for 1-day click or 7-day click. With over a million dollars of spend going out the door each month, it’s important to objectively verify performance and not rely on platform or last-click attribution.
3. Is your business omnichannel?
Just like it’s more complicated to advertise on multiple channels, it’s also harder to measure impact when you’re selling products in multiple places. For instance, maybe you sell items on your official site, on Amazon, and in retail stores. Tracking lift across these sales channels is hard — sometimes impossible — in platform reporting.
If this issue rings true to you, it's certainly time for an incrementality practice. When you run experiments with Haus, you can estimate the impact of media on all sales channels using the same methodology.
4. Have you hit a growth plateau?
Maybe you’ve had a couple rough quarters and you’re not quite sure where the problem is. With an incrementality practice in place, you can quickly identify pockets of opportunity and weed out inefficiencies in your media mix.
You might find a channel that appeared to be impactful based on platform metrics actually wasn’t incremental. In which case, you can sunset that channel and enjoy the savings — or reallocate that spend toward a channel that is working.
5. Are traditional MMM and MTA not quite cutting it?
Traditional media mix models (MMM) and multi-touch attribution (MTA) both rely on correlation rather than causation, which can lead you astray. Plus, MTA methodology is breaking down as privacy laws increase and traditional MMM takes too long to get an actionable read.
The good news is that you can use incrementality experiments to calibrate your models for more accurate results. Since incrementality testing is causal rather than correlative, these reads act as an anchor in MTA and traditional MMM. The more you calibrate to incrementality results, the better the models become.
Or better yet, you can opt for a Causal MMM, which grounds your MMM recommendations in experiments. Because you trust the scientific rigor behind your incrementality tests — so it makes sense to choose a model that is inherently directed and tuned by incrementality test results.
How do I measure incrementality?
You can measure incrementality by setting up a simple holdout test. This might involve running a nationwide marketing campaign in which 80% of the country sees the campaign and 20% doesn’t. The 80% audience segment is known as the treatment group, while the 20% audience segment is known as the holdout group. (You also might know it as the control group.)
Then you compare conversion data in these two groups to determine the incremental lift of your marketing campaign. You can calculate incremental lift using the following equation.
(Treatment group conversion rate — Holdout group conversion rate) ➗Holdout group conversion rate
So, if the treatment group converts at a rate of 0.05 and the holdout group converts at a rate of 0.02, your campaign's incremental lift would be 1.5. In more readable terms: Customers were 150% more likely to convert if they saw the ad, meaning the campaign was incremental.
Example: Running a simple incrementality test for Meta ads
Let’s unpack a real-world example of incrementality testing to drive the point home.
Say you lead growth marketing at a fitness brand. After years of relying on attribution, you finally invest in an incrementality testing platform to help you measure the true impact of your campaigns. You decide to start by testing the performance of your new Instagram ad campaign.
First, you create your treatment and holdout groups. Hopefully, you’re working with a partner who uses synthetic controls to create groups that are as characteristically similar as possible. This helps you isolate the Instagram ad as the single variable you’re tracking — ensuring a more precise comparison. You’ll also need to calibrate testing power, which includes choosing your test runtime and holdout size. You’ll also pick the KPI to track, which will be new app downloads.
Across your four-week test, you find that your treatment group has a 5.2% conversion rate, while your control group has a 3.8% conversion rate. You calculate incremental lift using the formula above, which comes out to a 36.8% incremental lift. That means the campaign generated 36.8% more downloads than it would have without the campaign.
From there, you can adjust your marketing strategy. You might be delighted with this number and choose to spend more ad dollars on Instagram. Or you might optimize this channel by testing to see the most incremental mix of upper-funnel to lower-funnel campaigns.
How to run an incrementality experiment
If you just answered “yes” to all of those questions, you’re probably wishing you started incrementality testing yesterday. No need to worry — it’s never too late. So to get you off to the races, let’s walk through how to run an incrementality experiment.
1. Design the experiment
If you’re interested in incrementality testing, there’s a good chance you have questions about your marketing that traditional measurement tools haven’t been able to answer. For now, pick the biggest question on the list. The one that keeps you up at night and may or may not be causing that stress rash on your lower back. (We can’t help you with that, sorry.)
As an example, let’s say your top question is: “Are we spending enough on YouTube?” You’ve suspected increasing ad spend could lead to a major lift in conversions for a while now, but it’s always been merely a hypothesis. So let’s design an experiment to finally answer this question.
Identify and set controls
Before you can launch your experiment, you need to control for all variables. These are the factors that could throw off your experiment if you aren’t careful.
We do this by creating test groups that are characteristically indistinguishable. If you were running testing a new hair growth medication, you wouldn’t test on one group of bald men and one group of men with lush, flowing manes. How would you be able to track outcomes?
In that same spirit, you want test groups with similar consumer behavior and similar historical sales data. This is where causal inference expertise comes in. Ideally, you want a team of experts who use synthetic controls to create comparable test groups. That way, you can minimize outliers and ensure precise, reliable results.
Determine your testing variable
Remember that burning question you had about YouTube ad spend? Of course you do. You’re thinking about it constantly. Well, that question will determine your testing variable, which is what varies between your test groups for the duration of the test. In this case, it’s YouTube ad spend.
Working with your incrementality partner, you set up three test groups. The first group will receive your business-as-usual (BAU) YouTube ad spend. The second group will receive double your BAU YouTube ad spend. And the third group, your control group, will receive no YouTube ads.
Pick your KPIs
How do you measure the success of your YouTube campaigns? If the goal is to drive Shopify new orders, then set “# of Shopify new orders” as your primary KPI. This will be the metric you track as your experiment begins.
Some platforms might enable you to pick multiple KPIs to track. Your primary KPI might be Shopify orders, but you might also track Amazon new orders as a secondary KPI. As we run the test, we’ll track how many Shopify and Amazon orders our three test groups generate.
Choose an experiment runtime
Before you can get off the races with your experiment, you need to figure out how long your experiment will run. If you run a longer experiment, you can be more confident in your experiment results. After all, sales trends tend to bounce up and down. But a longer runtime cancels out those ups and downs.
You also might want a longer experiment runtime if you have a high AOV and your product has a drawn-out sales cycle. Choosing a two-week test probably won’t be helpful if customers take months to convert.
So you should just pick the longest experiment runtime, right? Not necessarily. Longer experiments come with higher costs. For instance, if you’re running a four-week experiment with a 20% holdout group (i.e. 20% of your audience sees no marketing), you’ll have to determine how long you feel comfortable “under-marketing” to a certain portion of your audience.
While deciding on an experiment timeline alone can be tricky, it’s made simple when you partner with Haus. Our platform includes a calculator that shows the trade-off between the factors listed above and how powered your test will be, so you can confidently choose the duration and holdout percentage that’s best for your business.
2. Launch Your Test
Now that all your test groups and KPIs are worked out, it’s time to run your test. To do so effectively, you’ll need a platform that can reliably collect data on your KPIs in real-time. You’ll also want a comprehensive view into the KPIs, including amount lift, percent lift, and lift likelihood (which is the percentage chance the true lift percentage is greater than zero).
Once the results are ready, you’ll receive a notification from your customer success manager. They’ll pass along metrics as well as a qualitative summary that contextualizes your results. Then it’s time for the fun part: diving deep into the results.
3. Analyze your results — then take action
Finally, after weeks of anticipation, you receive the results of your incrementality test. If you’re working with Haus, you’ll receive the following metrics:
- Incrementality Factor: The estimated incremental conversions divided by the platform reported conversions.
- Lift Amount: The incremental amount of KPIs observed in the targeted regions during the analysis period.
- Lift Percent: This is the lift amount divided by the total business volume of that KPI.
- CPI (Cost per Incremental): Also known as CPIA or iROAS, this is the cost in dollars of driving one more incremental unit of this KPI.
With your toolkit of incrementality metrics, you can quickly spring into action. Here are a few potential next steps.
Optimize spend levels
Let’s return to that YouTube example. You get your results and find that lift is steep at your BAU ad spend, but lift flattens out when you double ad spend. Visually, it looks a bit like this:
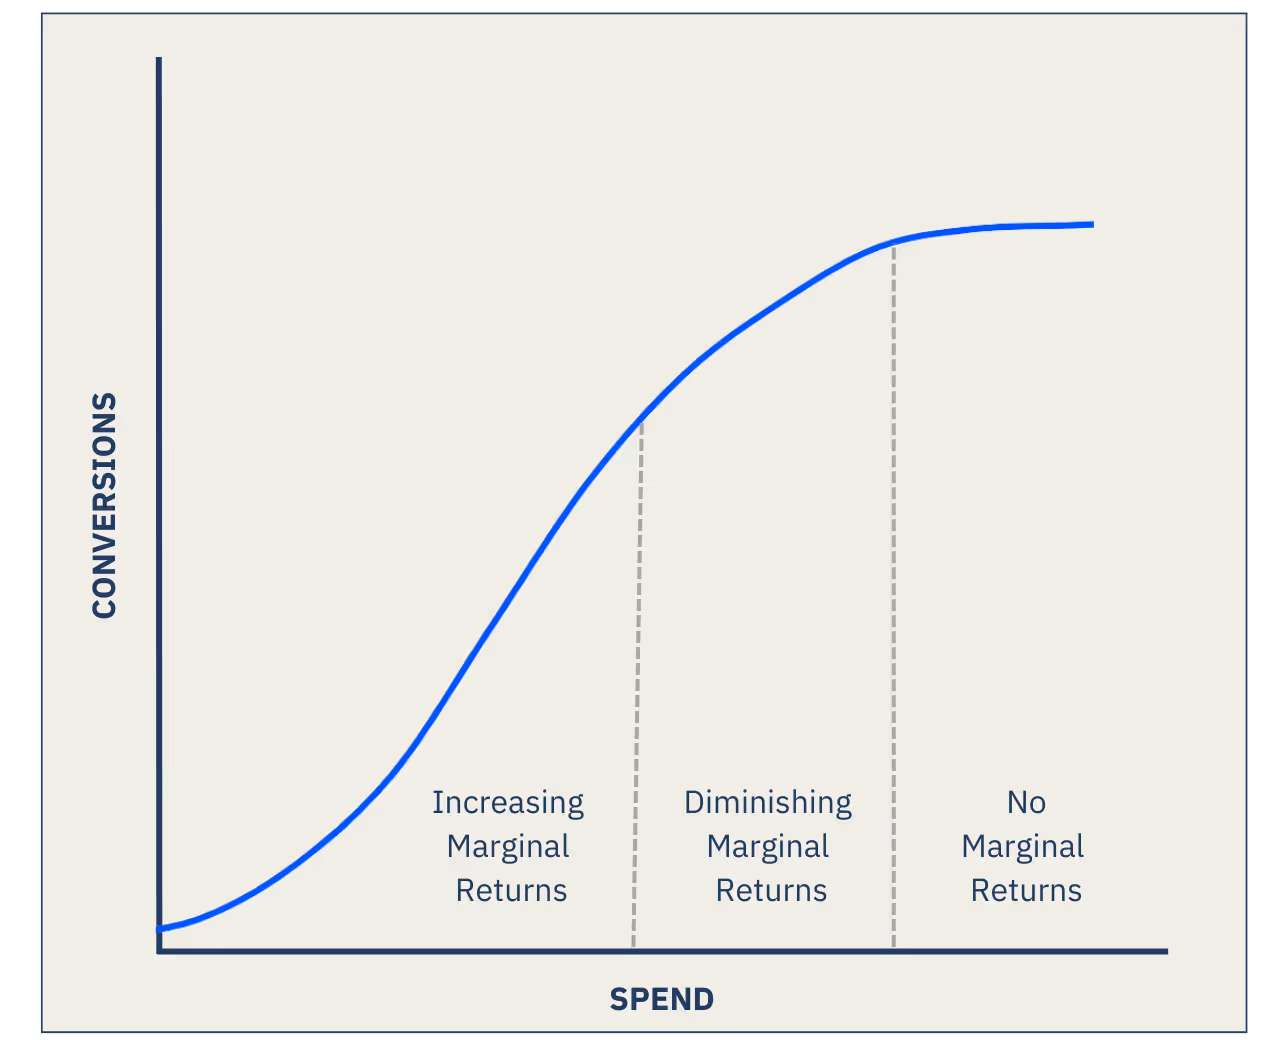
In short, you see diminishing returns at a certain spend level. So it’s a good thing you didn’t just follow your attribution metrics and double ad spend without testing first.
Plan your next test
As Aristotle is rumored to have said: “The more you know, the more you realize you don't know.” You might be feeling a bit like our dude Aristotle after testing your YouTube spend. After all, you just learned that increasing spend on there has diminishing returns — so now your mind reels. What about your other channels? Are you spending too much there? Too little? There’s only one way to find out — more testing.
Create proxy metrics with your incrementality factor
One standout metric is the incrementality factor (IF), which tells you — of all the conversions that the platform took credit for — how many were actually incremental.
Following your YouTube test, you decide TikTok is next up. The TikTok platform says you drove 1,000 conversions from your TikTok ads — but your test results show an IF of 0.6. This means only 600 of the 1,000 conversions were actually incremental. That means the TikTok platform is over crediting performance by 400 conversions or 40%.
Utilizing a proxy metric adjusted with an incrementality factor is a great way to calibrate your platform attribution and to determine a more accurate cost per incremental acquisitions (CPIA) or incremental return on ad spend (iROAS).
Determine new platform CPA thresholds
Beyond calculating a proxy metric, you can also use your incrementality results to determine your ideal ROAS or CPA threshold across different channels.
Using our previous example, let's say your company’s goal is to acquire new customers at a cost under $150. Prior to running this test, you thought your TikTok ads were driving customers at a CPA of $120. Now, that you ran your incrementality test, you realize that TikTok was really driving new customer acquisition at a cost of $200.
With this test under your belt, you have an accurate picture of the channel’s impact. You realize you need to lower the platform CPA. To figure out a platform CPA that would best reflect a true $150 cost per incremental acquisition, you use your Incrementality Factor once again. Just multiply the target CPA by your IF to get the new platform CPA threshold you should optimize against:
($150 CPA Goal ) * (0.60 IF) = $90 target platform CPA
This means, as long as you are seeing a TikTok-reported CPA of $90 or below, you can be confident that you are optimizing that platform effectively to hit the program wide CPA goal.
Calibrate your traditional MMM – or better yet, use a causal MMM
In general, running geo-experiments help to improve your traditional MMM by creating spend variation. However, you can also use the results of your experiments to upweight or down-weight each channel in your model.
Since your incrementality reads reflect true business impact, use the data to anchor your model. A traditional MMM can intake your incrementality reads and use them to adjust the model accordingly — making it causal.
Measure Incrementality with Haus
A well-designed incrementality test can offer plenty of answers — but a poorly-designed experiment might leave you with more questions. That’s why brands should invest in a true incrementality partner.
A partner like Haus doesn’t just bring a deep bench of causal inference experts and PhD economists. We also offer a dedicated customer success team made up of growth marketers just like yourself. They’ll offer actionable insights so that you can quickly put your results to work.
More than any other measurement approach, when incrementality is done right, it provides a true look at the effects of your marketing. But running well-designed experiments frequently can be complicated and time-consuming.
Haus’ experiments platform automates all the heavy lifting of experiment design and analysis. Our software brings you thorough, accurate incrementality results in weeks, not months, so you can make better, quicker investment decisions and stop guessing.
Additional resources
Ready to dive deep on incrementality? Check out other pages on the Haus blog to learn about…
- What you can test with incrementality – and the consequences of not testing.
- A scientific breakdown of different incrementality experimentation types.
- How brands measure incrementality today – and where other approaches fall flat.
- Some quick insights into the types of brands that actually need incrementality testing.
- How more brands are fostering a culture of experimentation – and how you can too.
FAQs about incrementality in marketing
How does incrementality testing improve marketing measurement accuracy?
Incrementality testing shifts focus from correlation-based attribution to causal impact, revealing the true uplift in conversions directly attributable to a marketing activity. Unlike traditional methods that might claim credit for sales that would have occurred anyway, incrementality isolates the actual impact of an ad or campaign. This provides a more precise understanding of marketing effectiveness, preventing inflated performance metrics and enabling smarter budget allocation. It helps marketers understand what truly causes growth, especially crucial in a privacy-centric advertising landscape.
What are the common methodologies for conducting incrementality tests?
The primary method involves setting up controlled experiments, often using holdout groups where a portion of the audience is intentionally not exposed to a specific marketing effort. By comparing the outcomes of this control group to a treatment group that was exposed, marketers can scientifically determine the incremental lift. Other methods include geo-lifting, A/B testing variations, and advanced causal inference models, all designed to isolate the impact of specific marketing variables. These approaches aim to create comparable test environments to ensure reliable results.
When should businesses prioritize investing in incrementality testing?
Businesses should consider incrementality testing when they are spending significant amounts on marketing (e.g., over $1M/month) across multiple channels. This especially true if their operations are omnichannel or if they've hit a growth plateau. It becomes particularly valuable when traditional media mix models or multi-touch attribution aren't providing clear, actionable insights due to their reliance on correlation rather than causation. Implementing incrementality helps ensure that marketing spend is truly efficient and drives measurable impact.
What actionable insights can be derived from incrementality test results?
Incrementality test results provide clear metrics such as incremental lift, incrementality factor, and cost per incremental acquisition (CPIA), enabling marketers to optimize their spend levels by identifying diminishing returns. These insights allow for reallocation of budget towards more effective channels or campaigns. They also help to calibrate internal attribution models for greater accuracy. Ultimately, the data supports informed decisions to maximize return on ad spend (ROAS) and foster a continuous culture of experimentation.

.png)
.png)

.png)

.avif)


.avif)
.avif)

.avif)

.avif)

.avif)
.avif)
.avif)


.avif)


.avif)


.avif)
.avif)
.avif)
.avif)
.png)
.png)
.avif)


.avif)
.avif)
.avif)
.avif)
.avif)
.avif)

.avif)

.avif)

.avif)

.avif)
.avif)
.avif)
.avif)
.avif)


.avif)
.avif)

.avif)
.avif)

.avif)
.avif)
.avif)

.avif)

.avif)
.avif)
.avif)
.avif)

.avif)


.avif)
.avif)


.avif)
.avif)
.avif)

.avif)
.avif)
.avif)
.avif)
.avif)
.avif)


.png)
.avif)
.png)
.avif)